Ewald F. Fuchs - Introduction to Energy, Renewable Energy and Electrical Engineering
Здесь есть возможность читать онлайн «Ewald F. Fuchs - Introduction to Energy, Renewable Energy and Electrical Engineering» — ознакомительный отрывок электронной книги совершенно бесплатно, а после прочтения отрывка купить полную версию. В некоторых случаях можно слушать аудио, скачать через торрент в формате fb2 и присутствует краткое содержание. Жанр: unrecognised, на английском языке. Описание произведения, (предисловие) а так же отзывы посетителей доступны на портале библиотеки ЛибКат.
- Название:Introduction to Energy, Renewable Energy and Electrical Engineering
- Автор:
- Жанр:
- Год:неизвестен
- ISBN:нет данных
- Рейтинг книги:5 / 5. Голосов: 1
-
Избранное:Добавить в избранное
- Отзывы:
-
Ваша оценка:
Introduction to Energy, Renewable Energy and Electrical Engineering: краткое содержание, описание и аннотация
Предлагаем к чтению аннотацию, описание, краткое содержание или предисловие (зависит от того, что написал сам автор книги «Introduction to Energy, Renewable Energy and Electrical Engineering»). Если вы не нашли необходимую информацию о книге — напишите в комментариях, мы постараемся отыскать её.
A combination of analytical and software solutions in order to relate aspects of electric circuits at an accessible level A thorough description of compensation of flux weakening (CFW) applied to inverter-fed, variable-speed drives not seen anywhere else in the literature Numerous application examples of solutions using PSPICE, Mathematica, and finite difference/finite element solutions such as detailed magnetic flux distributions Manufacturing of electric energy in power systems with integrated renewable energy sources where three-phase inverter supply energy to interconnected, smart power systems Connecting the energy-related technology and application discussions with urgent issues of energy conservation and renewable energy—such as photovoltaics and ground-water heat pump resulting in a zero-emissions dwelling—
crafts a truly modern and relevant approach to its subject matter.
Introduction to Energy, Renewable Energy and Electrical Engineering — читать онлайн ознакомительный отрывок
Ниже представлен текст книги, разбитый по страницам. Система сохранения места последней прочитанной страницы, позволяет с удобством читать онлайн бесплатно книгу «Introduction to Energy, Renewable Energy and Electrical Engineering», без необходимости каждый раз заново искать на чём Вы остановились. Поставьте закладку, и сможете в любой момент перейти на страницу, на которой закончили чтение.
Интервал:
Закладка:
This book has evolved chiefly from the content of undergraduate electrical and energy engineering courses taught by the first author at the University of Colorado at Boulder and also draws on the second author's research experience at the University of California Berkeley's Energy and Resources Group and at the Lawrence Berkeley National Laboratory. It is suitable for students who do not have educational background in energy and electrical engineering, as well as for practicing engineers who want to refresh and enhance their knowledge in these disciplines through 125 application example solutions, 157 problems and their solutions in the 309-page Instructor Manual, and more than 449 reference citations (mostly journal and conference papers, as well as national and international standards and guidelines). The extensive and detailed inclusion of practical applications stresses learning by example. Up‐to‐date references are given through the inclusion of Internet addresses. The “Système International” (SI) of units has been used throughout with some reference to the American/English system of units. Note that mass has the units (e.g. kg or lb) and weight has the units (e.g. kg‐force or lb‐force), where lb stands for “librum” as used in the English technical literature.
P.1 Key Features
Provides theoretical and practical insight into renewable energy problems.
125 practical application (example) problems with solutions, some implemented in PSPICE and Mathematica.
A total of 157 problems at the end of the chapters dealing with practical applications to electric, electronic, and renewable/energy engineering. Solutions to these problems are provided in a 309-page Solution Manual.
P.2 The Climate Dilemma
Figure P.1illustrates the present warming distribution throughout the earth as published by National Aeronautics and Space Administration ’s ( NASA) Goddard Space Flight Center [1] where the measured global temperature during 2014 – indexed to the average values during the twentieth century – has increased by 0.68 °C. This average temperature increase, driven chiefly by human influence on the global carbon cycle as illustrated in Figure P.2through deforestation and unrelenting emissions of greenhouse gases, captures our rationale for writing this book.
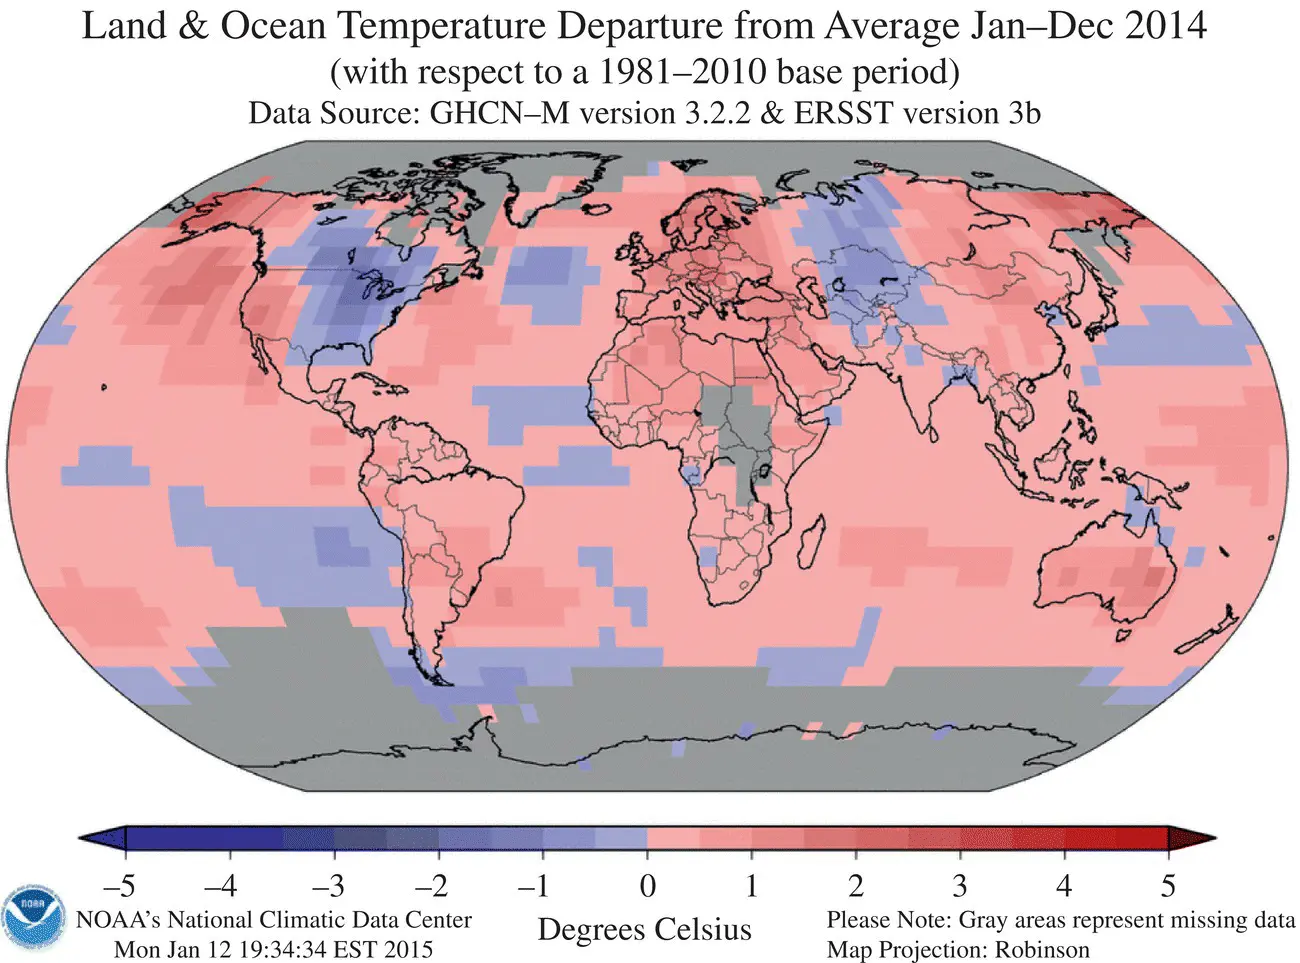
Figure P.1 Measured temperature anomalies during 2014 referring to the average values during the twentieth century, where the global average temperature in 2014 has increased [1] by 0.68 °C.
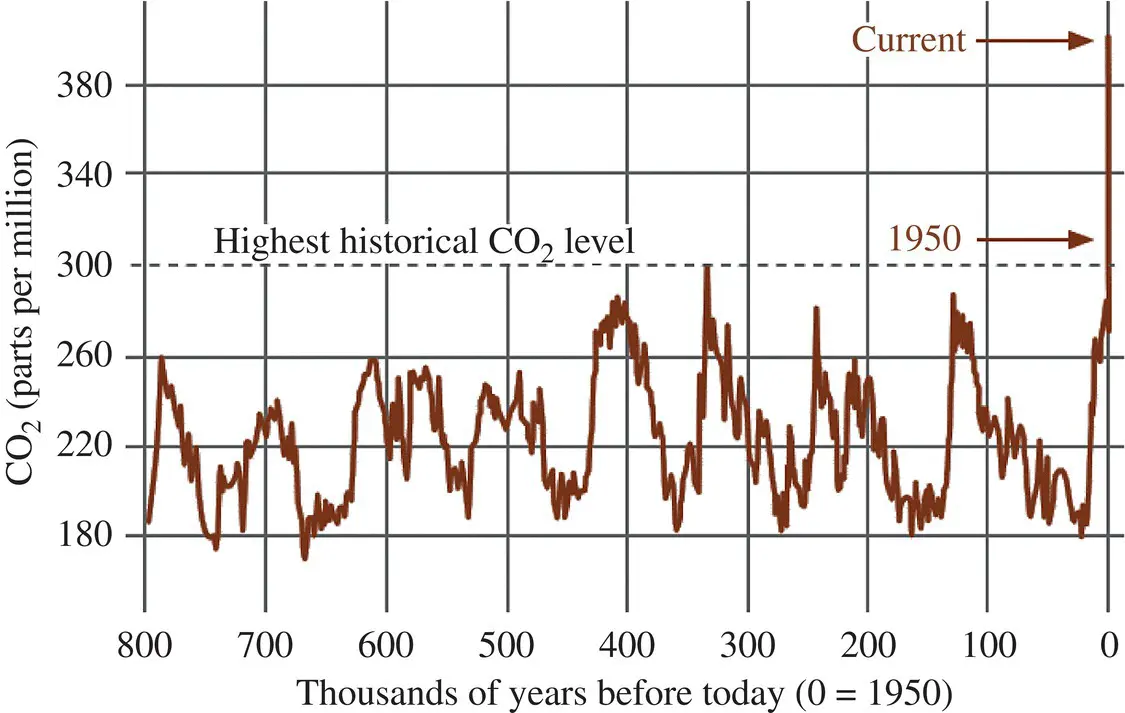
Figure P.2 CO 2variation and increase [2] during the past 800 000 years.
A 2008 paper by NASA scientist James Hansen [3] shows that the true gravity of the situation due to human, or anthropogenic, effects on the environment includes impacts on biophysical environments, biodiversity, and other natural resources. Hansen set out to determine what level of atmospheric carbon dioxide (CO 2) society should aim for “if humanity wishes to preserve a planet similar to that on which civilization developed and to which life on Earth is adapted.” His climate models show that exceeding 350 parts per million (ppm) CO 2in the atmosphere would likely have catastrophic effects. We have already surpassed that limit because environmental monitoring showed concentrations of around 400 ppm in 2014. This is particularly problematic because CO 2and other greenhouse [4] gases (see Table P.1) remain in the atmosphere for a long time. Even if we shut down every fossil‐fueled power plant today, existing greenhouse gases will continue to warm the planet.
Table P.1 Greenhouse gases and their chemical formula, anthropogenic sources, atmospheric lifetime, and global warming potential (GWP) [4].
| Greenhouse gas | Chemical formula | Anthropogenic sources | Atmospheric lifetime [1](years) | GWP [2] (100‐year time horizon) |
|---|---|---|---|---|
| Carbon dioxide | CO 2 | Fossil fuel combustion, land‐use conversion, cement production | ~100 [1] | 1 |
| Methane | CH 4 | Fossil fuels, rice paddies, waste dumps | 12 [1] | 25 |
| Nitrous oxide | N 2O | Fertilizer, industrial processes, combustion | 114 [1] | 298 |
| Tropospheric ozone | O 3 | Fossil fuel combustion, industrial emissions, chemical solvents | Hours‐days | NA |
| CFC‐12 | CCL 2F 2 | Liquid coolants, foams | 100 | 10 900 |
| HCFC‐22 | CCl 2F 2 | Refrigerants | 12 | 1 810 |
| Sulfur hexafluoride | SF 6 | Dielectric fluid | 3 200 | 22 800 |
The climate conundrum [5] is best illustrated in Figure P.3, which shows two sharply divergent pathways for CO 2emissions: “business as usual” and the “best‐case scenario” of CO 2emissions in billions of metric tons. Figure P.4depicts the CO 2accumulations in the atmosphere for “business as usual,” “best‐case scenario,” “Hansen model,” and “safety threshold” scenarios. Achieving the deep cuts in carbon emissions required to step down from the business‐as‐usual trajectory to one with increased probability of climate stability is a monumental task. Fossil fuels and extractive industries are currently deeply interconnected with Western lifestyles, infrastructure, and typical economic development pathways. Making the leap will require political commitment to pricing carbon, continued innovation in low‐carbon energy and storage, and the imagination and flexibility to envision – and bring about – a more resilient future.
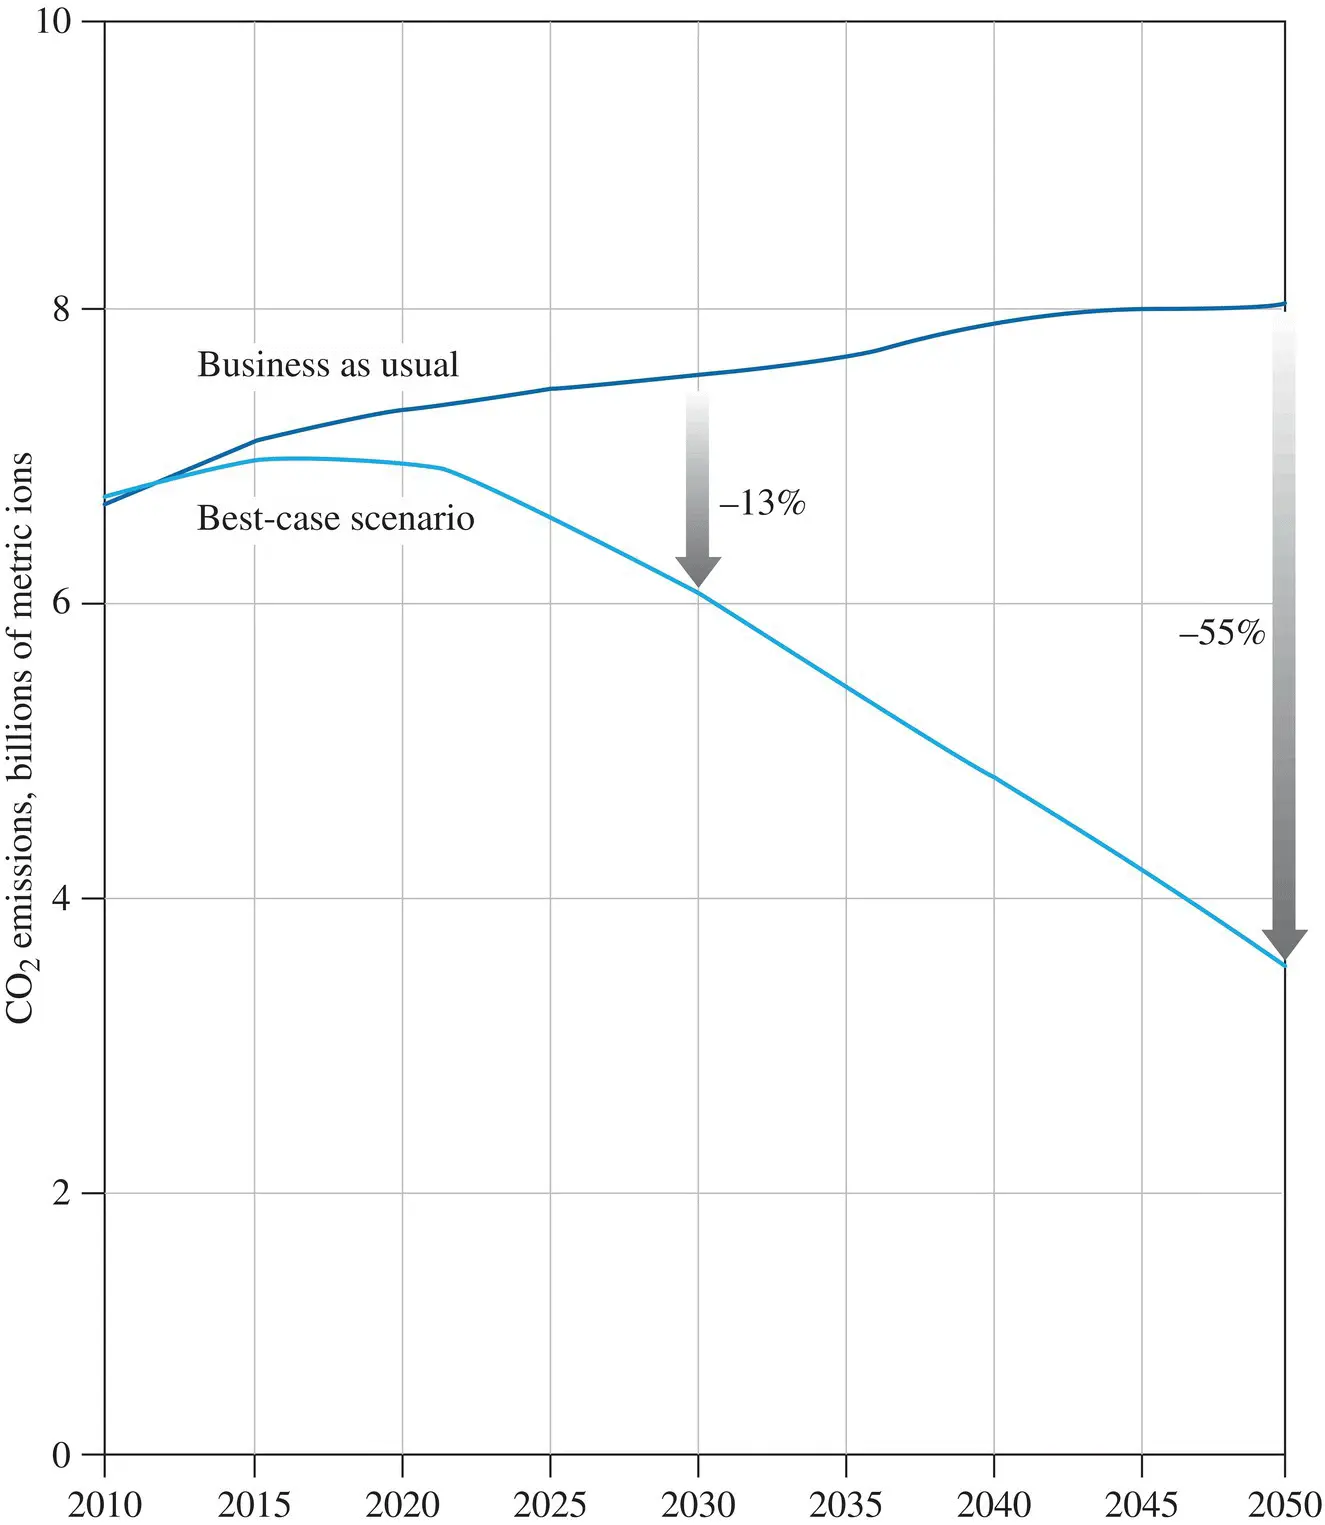
Figure P.3 Possible emissions pathways [5], billions of metric tons of CO 2.
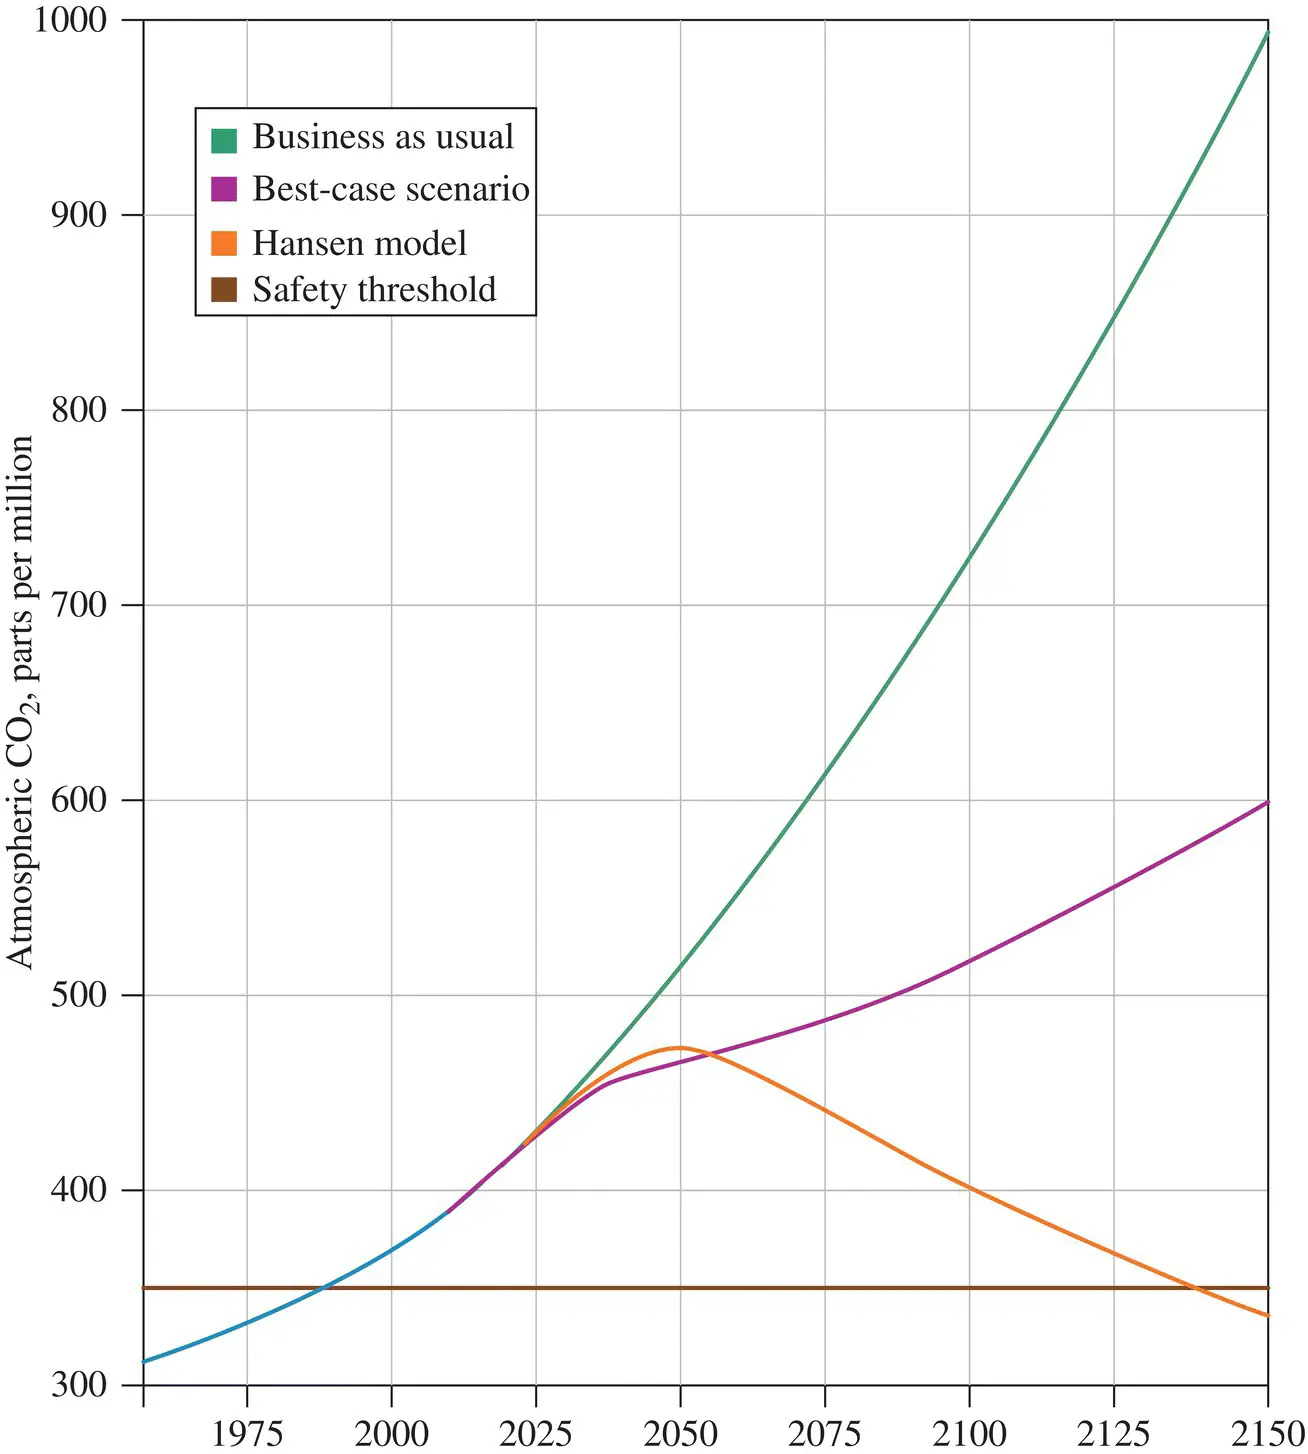
Figure P.4 Divergent scenarios [5] for atmospheric CO 2in parts per million (ppm).
P.2.1 Is the Renewable Energy Approach Too Optimistic?
Figures and Table P.1require that the continued accumulation of CO 2and other greenhouse gases in the atmosphere must be avoided by relying on renewable energy based on solar, wind, hydro, and biomass power plants in Germany as indicated in Figure P.5. While during summertime these renewable energy sources generate to date more than 30% of electric energy usage, this is not so during winter when clouds/fog and calm weather conditions prevail with wind speeds too low to operate wind turbines either onshore or offshore as indicated in Figure P.5, where 26 000 wind turbines and 1.2 million solar plants within the German grid failed for almost two weeks to generate expected sufficient energy. This was due to regional atmospheric high pressure resulting in fog and still air conditions as frequently occur in Central Europe during cold weather. Such a “foggy calm [6, 7]” – called in German “Dunkelflaute” – brought the grid near its limits, where 80 GW must be available to serve peak‐load conditions as indicated in Figure P.5.
Читать дальшеИнтервал:
Закладка:
Похожие книги на «Introduction to Energy, Renewable Energy and Electrical Engineering»
Представляем Вашему вниманию похожие книги на «Introduction to Energy, Renewable Energy and Electrical Engineering» списком для выбора. Мы отобрали схожую по названию и смыслу литературу в надежде предоставить читателям больше вариантов отыскать новые, интересные, ещё непрочитанные произведения.


Обсуждение, отзывы о книге «Introduction to Energy, Renewable Energy and Electrical Engineering» и просто собственные мнения читателей. Оставьте ваши комментарии, напишите, что Вы думаете о произведении, его смысле или главных героях. Укажите что конкретно понравилось, а что нет, и почему Вы так считаете.