Clinical Pharmacology and Therapeutics
Здесь есть возможность читать онлайн «Clinical Pharmacology and Therapeutics» — ознакомительный отрывок электронной книги совершенно бесплатно, а после прочтения отрывка купить полную версию. В некоторых случаях можно слушать аудио, скачать через торрент в формате fb2 и присутствует краткое содержание. Жанр: unrecognised, на английском языке. Описание произведения, (предисловие) а так же отзывы посетителей доступны на портале библиотеки ЛибКат.
- Название:Clinical Pharmacology and Therapeutics
- Автор:
- Жанр:
- Год:неизвестен
- ISBN:нет данных
- Рейтинг книги:5 / 5. Голосов: 1
-
Избранное:Добавить в избранное
- Отзывы:
-
Ваша оценка:
Clinical Pharmacology and Therapeutics: краткое содержание, описание и аннотация
Предлагаем к чтению аннотацию, описание, краткое содержание или предисловие (зависит от того, что написал сам автор книги «Clinical Pharmacology and Therapeutics»). Если вы не нашли необходимую информацию о книге — напишите в комментариях, мы постараемся отыскать её.
provides concise yet thorough coverage of the principles of clinical pharmacology, the major characteristics of therapeutics, and the practical aspects of prescribing drugs to alleviate symptoms and to treat disease.
Whether you are preparing for examinations or prescribing to patients, the tenth edition offers readers current and authoritative insight into the essential practical and clinical knowledge. Logically organised chapters allow for rapid location of key information, while examples of commonly encountered scenarios illustrate how and when to use drugs in clinical situations. Throughout the text, practice questions, prescribing guidelines, and self-assessment tests clarify and reinforce the principles that inform appropriate clinical decision-making.
Presents an up-to-date review of drug use across all major clinical disciplines Offers a timely overview of clinical drug trials and development Provides new clinical scenarios to relate chapter content to real-life application Contains colour-coded “Key Points” and “Prescribing Points” to highlight important information Includes chapter introductions and summaries, and numerous figures, tables, and colour illustrations is an essential resource for medical students, junior doctors, and other prescribers looking for an up-to-date reference on pharmacological principles, prescribing, and therapeutics.
Clinical Pharmacology and Therapeutics — читать онлайн ознакомительный отрывок
Ниже представлен текст книги, разбитый по страницам. Система сохранения места последней прочитанной страницы, позволяет с удобством читать онлайн бесплатно книгу «Clinical Pharmacology and Therapeutics», без необходимости каждый раз заново искать на чём Вы остановились. Поставьте закладку, и сможете в любой момент перейти на страницу, на которой закончили чтение.
Интервал:
Закладка:
First‐pass metabolism refers to metabolism of a drug that occurs en route from the gut lumen to the systemic circulation. For the majority of drugs given orally, absorption occurs across the portion of gastrointestinal epithelium that is drained by veins forming part of the hepatoportal system. Consequently, even if they are well absorbed, drugs must pass through the liver before reaching the systemic circulation. For drugs that are susceptible to extensive hepatic metabolism, a substantial proportion of an orally administered dose can be metabolised before it ever reaches its site of pharmacological action, e.g. insulin metabolism in the gut lumen is so extensive that it renders oral therapy impossible. Other drugs which undergo extensive hepatic metabolism include propranolol, lidocaine and morphine.
First‐pass metabolism has several clinical implications:
1 The appropriate route has to be selected for a drug in order to obtain its clinical effect
2 It accounts for the variability in drug bioavailability between individuals
3 Liver disease can reduce the first‐pass effect and result in an increase in bioavailability. This is discussed in greater detail later in this section.
Distribution
Once a drug has gained access to the bloodstream, it begins to distribute to the tissues. The extent of this distribution depends on a number of factors including plasma protein binding, lipid solubility and regional blood flow. The volume of distribution, V D, is the apparent volume of fluid into which a drug distributes based on the amount of drug in the body and the measured concentration in the plasma or serum. If a drug was wholly confined to the plasma, V Dwould equal the plasma volume – approximately 3 L in an adult. If, on the other hand, the drug was distributed throughout the body water, V Dwould be approximately 42 L. In reality, drugs are rarely distributed into physiologically relevant volumes. If most of the drug is bound to tissues, the plasma concentration will be low and the apparent V Dwill be high, while high plasma protein binding will tend to maintain high concentrations in the blood and a low V Dwill result. For the majority of drugs, V Ddepends on the balance between plasma binding and sequestration or binding by various body tissues, for example, muscle and fat. Volume of distribution can therefore vary considerably.
Clinical relevance of volume of distribution
Knowledge of volume of distribution ( V D) can be used to determine the size of a loading dose if an immediate response to treatment is required. This assumes that therapeutic success is closely related to the plasma concentration and that there are no adverse effects if a relatively large dose is suddenly administered. It is sometimes employed when drug response would take many hours or days to develop if the regular maintenance dose was given from the outset, e.g. digoxin.
In practice, weight is the main determinant to calculating the dose of a drug where there is a narrow therapeutic index.
Plasma protein binding
In the blood, a proportion of a drug is bound to plasma proteins – mainly albumin (acidic drugs) and α 1‐acid glycoprotein (basic drugs). Only the unbound, or free, fraction distributes because the protein‐bound complex is too large to pass through membranes. It is the unbound portion that is generally responsible for clinical effects – both the target response and the unwanted adverse effects. Changes in protein binding (e.g. resulting from displacement interactions) generally lead to a transient increase in free concentration but are rarely clinically relevant. However, a lower total concentration will be present and the measurement might be misinterpreted if the higher free fraction is not taken into account. This is a common problem with the interpretation of phenytoin concentrations, where free fraction can range from 10% in a normal patient to 40% in a patient with hypoalbuminaemia and renal impairment.
Clearance
Clearance is the sum of all drug‐eliminating processes, principally determined by hepatic metabolism and renal excretion. It can be defined as the theoretical volume of fluid from which a drug is completely removed in a given period of time.
When a drug is administered continuously by intravenous infusion or repetitively by mouth, a balance is eventually achieved between its input (dosing rate) and its output (the amount eliminated over a given period of time). This balance gives rise to a constant amount of drug in the body which depends on the dosing rate and clearance. This amount is reflected in the plasma or serum as a steady‐state concentration ( C ss). A constant rate intravenous infusion will yield a constant C ss, while a drug administered orally at regular intervals will result in fluctuation between peak and trough concentrations ( Figure 1.3).
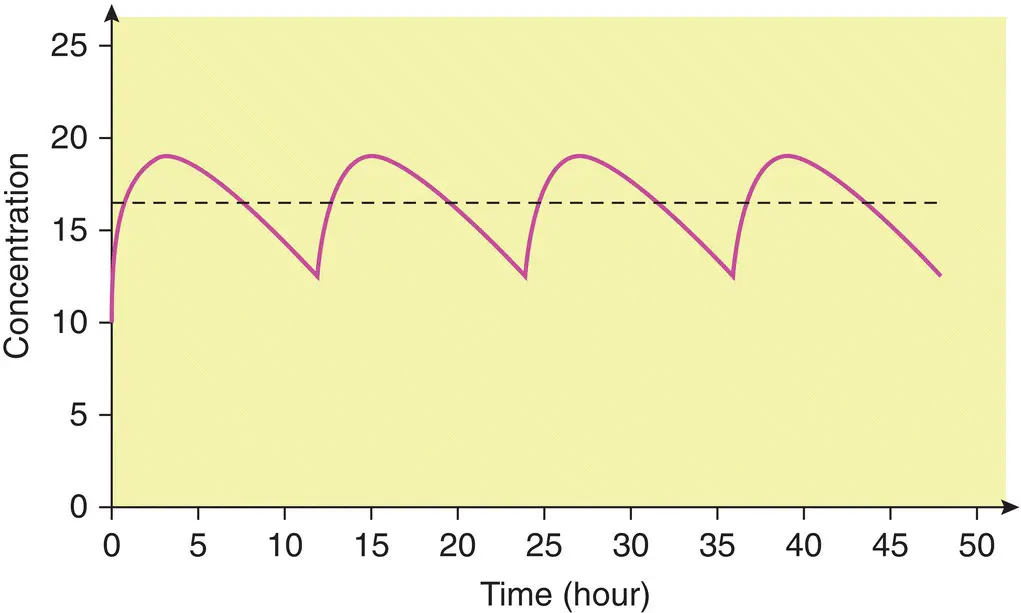
Figure 1.3 Steady‐state concentration–time profile for an oral dose (—) and a constant rate intravenous infusion (‐ ‐ ‐ ‐ ‐).
Clearance depends critically on the efficiency with which the liver and/or kidneys can eliminate a drug; it will vary in disease states that affect these organs, or that affect the blood flow to these organs. In stable clinical conditions, clearance remains constant and is directly proportional to dose rate. The important implication is that if the dose rate is doubled, the C ss averagedoubles: if the dose rate is halved, the C ss averageis halved for most drugs. In pharmacokinetic terms, this is referred to as a first‐order or linear process, and results from the fact that the rate of elimination is proportional to the amount of drug present in the body.
Single intravenous bolus dose
A number of other important pharmacokinetic principles can be appreciated by considering the concentrations that result following a single intravenous bolus dose (see Figure 1.4) and through a number of complex equations the time at which steady state will be achieved after starting a regular treatment schedule or after any change in dose can be predicted.
As a rule, in the absence of a loading dose, steady state is attained after four to five half‐lives ( Figure 1.5).
Furthermore, when toxic drug levels have been inadvertently produced, it is very useful to estimate how long it will take for such levels to reach the therapeutic range, or how long it will take for the entire drug to be eliminated once the drug has been stopped. Usually, elimination is effectively complete after four to five half‐lives ( Figure 1.6).
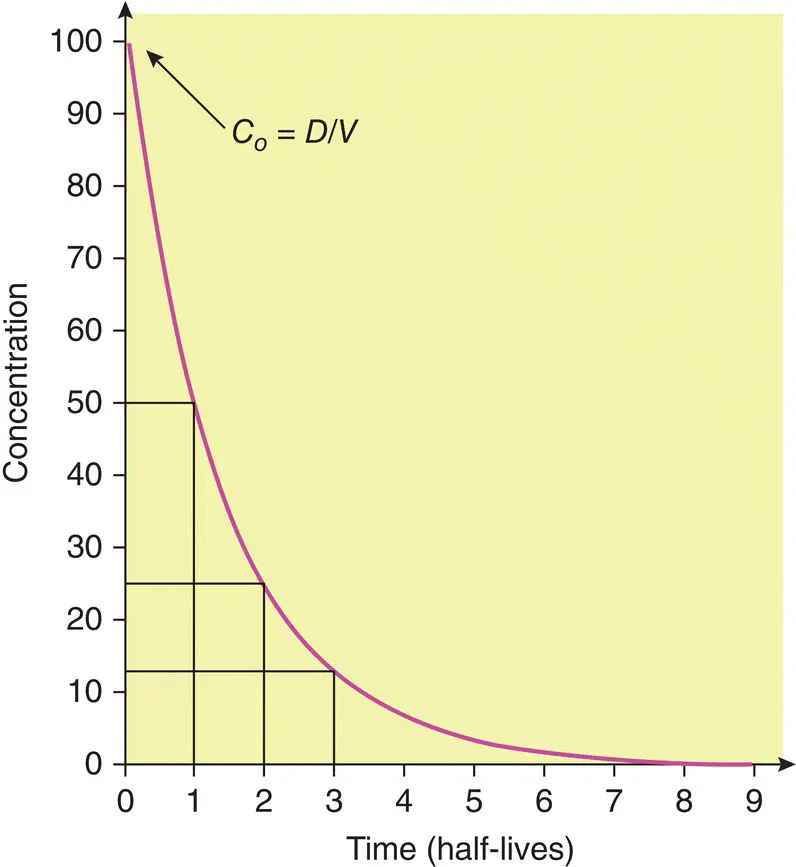
Figure 1.4 Plot of concentration versus time after a bolus intravenous injection. The intercept on the y‐ (concentration) axis, C 0, is the concentration resulting from the instantaneous injection of the bolus dose.
The elimination half‐life can also be used to determine dosage intervals to achieve a target concentration–time profile. For example, in order to obtain a gentamicin peak of 8 mg/L and a trough of 0.5 mg/L in a patient with an elimination half‐life of 3 hours, the dosage interval should be 12 hours. (The concentration will fall from 8 to 4 mg/L in 3 hours, to 2 mg/L in 6 hours, to 1 mg/L in 9 hours and to 0.5 mg/L in 12 hours.) However, for many drugs, dosage regimens should be designed to maintain concentrations within a range that avoids high (potentially toxic) peaks or low, ineffective troughs. Excessive fluctuations in the concentration–time profile can be prevented by giving the drug at intervals of less than one half‐life or by using a slow‐release formulation.
Читать дальшеИнтервал:
Закладка:
Похожие книги на «Clinical Pharmacology and Therapeutics»
Представляем Вашему вниманию похожие книги на «Clinical Pharmacology and Therapeutics» списком для выбора. Мы отобрали схожую по названию и смыслу литературу в надежде предоставить читателям больше вариантов отыскать новые, интересные, ещё непрочитанные произведения.


Обсуждение, отзывы о книге «Clinical Pharmacology and Therapeutics» и просто собственные мнения читателей. Оставьте ваши комментарии, напишите, что Вы думаете о произведении, его смысле или главных героях. Укажите что конкретно понравилось, а что нет, и почему Вы так считаете.