Michael Begon - Ecology
Здесь есть возможность читать онлайн «Michael Begon - Ecology» — ознакомительный отрывок электронной книги совершенно бесплатно, а после прочтения отрывка купить полную версию. В некоторых случаях можно слушать аудио, скачать через торрент в формате fb2 и присутствует краткое содержание. Жанр: unrecognised, на английском языке. Описание произведения, (предисловие) а так же отзывы посетителей доступны на портале библиотеки ЛибКат.

- Название:Ecology
- Автор:
- Жанр:
- Год:неизвестен
- ISBN:нет данных
- Рейтинг книги:5 / 5. Голосов: 1
-
Избранное:Добавить в избранное
- Отзывы:
-
Ваша оценка:
Ecology: краткое содержание, описание и аннотация
Предлагаем к чтению аннотацию, описание, краткое содержание или предисловие (зависит от того, что написал сам автор книги «Ecology»). Если вы не нашли необходимую информацию о книге — напишите в комментариях, мы постараемся отыскать её.
– now in full colour – offers students and practitioners a review of the ecological sciences.
The previous editions of this book earned the authors the prestigious ‘Exceptional Life-time Achievement Award’ of the British Ecological Society – the aim for the fifth edition is not only to maintain standards but indeed to enhance its coverage of Ecology.
In the first edition, 34 years ago, it seemed acceptable for ecologists to hold a comfortable, objective, not to say aloof position, from which the ecological communities around us were simply material for which we sought a scientific understanding. Now, we must accept the immediacy of the many environmental problems that threaten us and the responsibility of ecologists to play their full part in addressing these problems. This fifth edition addresses this challenge, with several chapters devoted entirely to applied topics, and examples of how ecological principles have been applied to problems facing us highlighted throughout the remaining nineteen chapters.
Nonetheless, the authors remain wedded to the belief that environmental action can only ever be as sound as the ecological principles on which it is based. Hence, while trying harder than ever to help improve preparedness for addressing the environmental problems of the years ahead, the book remains, in its essence, an exposition of the
of ecology. This new edition incorporates the results from more than a thousand recent studies into a fully up-to-date text.
Written for students of ecology, researchers and practitioners, the fifth edition of
is anessential reference to all aspects of ecology and addresses environmental problems of the future.
Ecology — читать онлайн ознакомительный отрывок
Ниже представлен текст книги, разбитый по страницам. Система сохранения места последней прочитанной страницы, позволяет с удобством читать онлайн бесплатно книгу «Ecology», без необходимости каждый раз заново искать на чём Вы остановились. Поставьте закладку, и сможете в любой момент перейти на страницу, на которой закончили чтение.
Интервал:
Закладка:
Source : After Van Oosten et al . (2015).
A matrix model integrating data on survival and fecundity was fitted to these demographic data and proved successful in recreating the observed population dynamics ( Figure 4.18a), which in turn provides us with confidence that the IPM can usefully be used in an LTRE analysis. The results of this are shown in Figure 4.18b, comparing populations A and C to population D, as a benchmark, in terms of the contributions of the differences in vital rates to the overall differences in R . The relatively high rate of increase at site C (albeit from a low base) appears to be driven largely by immigration with some contribution from juvenile survival. The clear decrease at site A ( R negative) resulted from low fecundity and adult survival.
The LTRE analysis, therefore, argues, most fundamentally, for customised approaches to be taken to local populations, since the forces driving their dynamics can be so different. Indeed, Van Oosten et al . (2015) conclude their study by explaining how they have responded to the analysis. To counteract the problems at site A, they introduced wire mesh covers to protect the nests and nesting adults, which led to an immediate more‐than‐doubling of fecundity and no predation by foxes, previously the main culprits. To support site C, so reliant on immigration, their strategy has been to protect site D, the main source of those immigrants. Fortunately, site D itself supports the most stable population of the three, and the strategy therefore is simply to protect the habitat there for the sake of that population and of others, like C, that rely on it.
4.8.3 Sensitivity and elasticity analysis
sensitivities and elasticities
In contrast to the retrospective LTRE analysis of the data contained in population projection matrices or IPMs, it is also possible to carry out pros pective sensitivity or elasticity analyses (Caswell, 2001). Without going into the algebraic details, the general principle is one of ‘perturbing’ the values of elements, or combinations of elements, in the matrix, and then noting the effects of those perturbations on aggregate properties such as R . The sensitivity of each element (i.e. each transition, birth or survival, in the overall life cycle) is the amount by which R would change for a given absolute change in the value of the matrix element, with the value of all the other elements held constant. Thus, sensitivities are highest for those processes that have the greatest power to influence R . However, whereas survival elements ( g s and p s) are constrained to lie between 0 and 1, fecundities are not, and R therefore tends to be more sensitive to absolute changes in survival than to absolute changes of the same magnitude in fecundity. Moreover, R can be sensitive to an element in the matrix even if that element takes the value 0 (because sensitivities measure what would happen if there was an absolute change in its value). These shortcomings are overcome, though, by using the elasticity of each element to determine its contribution to R , since this measures the proportional change in R resulting from a proportional change in that element. Conveniently, too, with the matrix formulation, the elasticities sum to 1, so that the meaning of an elasticity of 0.5, say, is clear: the element concerned accounts for half the variation in R .
APPLICATION 4.4 Elasticity analysis and population management
elasticity analysis and the management of armadillo abundance
Elasticity analysis offers an especially direct route towards focused plans for the management of abundance. For example, an elasticity analysis has been applied to the population dynamics of nine‐banded armadillos, Dasypus novemcinctus , in Mississippi, USA. The armadillo is a reservoir of infection of the causative agent of leprosy, Mycobacterium leprae , and indeed the only known non‐human vertebrate host of the disease in the Americas (see Oli et al . (2017) who also carry out an elasticity analysis of leprosy dynamics within the armadillo populations). Globally, between 200 000 and 300 000 new human cases of leprosy are reported annually. Given the popular view of leprosy as a disease of a bygone era, a surprising number of these cases (around 200) are in southern USA, and these are increasingly being linked to infected armadillos. An understanding of the forces driving the population dynamics of the armadillos is important, therefore, because the risk of human infection increases with the abundance of infected armadillos, and hence with the abundance of the armadillos themselves. (The ecology of these ‘zoonotic’ infections, passed from wildlife to humans, is discussed in more detail in Section 12.3.2.) A life cycle graph and associated population projection matrix for armadillos is shown in Figure 4.19a. Three age classes are distinguished: juveniles (0–1 years old, prereproductive), yearlings (1–2 years) and adults (>2 years), though these adults may also transition into an infected (leprous) state that can also reproduce. Estimates for the various elements of the matrix, from field data, are shown in Figure 4.19b. The reproductive rates describe additions to the free‐living juvenile class, since these, rather than newborns, are the youngest animals that can be trapped. However, the survival rate from birth to becoming trappable is unknown. The matrix model was therefore run for low, medium and high values for this survival rate, γ (0.5, 0.8 and 1.0). The elasticities of the various elements of the matrix are shown in Figure 4.19c.
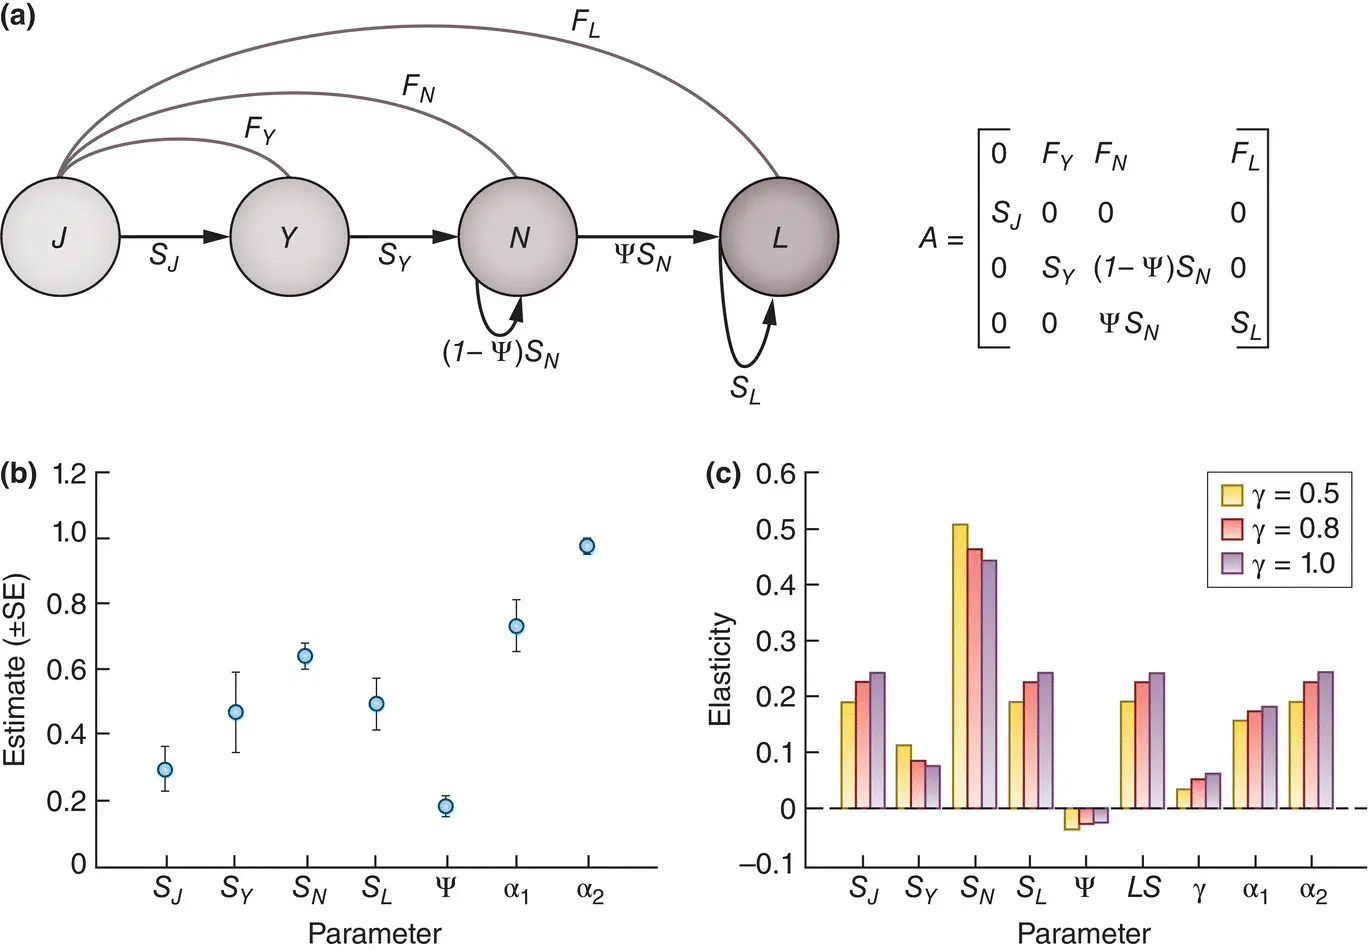
Figure 4.19 Elasticity analyses can guide the management of armadillo abundance.(a) Life cycle graph and population projection matrix for nine‐banded armadillos, Dasypus novemcinctus , in Mississippi, USA, comprising fecundities, F , and survival rates, S , for juveniles, J , yearlings, Y , non‐leprous adults, N , and leprous adults, L , and with ψ referring to the probability of non‐leprous adults becoming leprous. (b) Estimates, with standard errors, of these parameters from field data, except that α 1(yearlings) and α 2(adults) are probabilities of reproduction that are combined with litter sizes to generate the fecundities. (c) The elasticities of the population growth rate, R , to these parameters, to litter size ( LS ) and to the (unknown) probability of surviving to a trappable age, γ, for three values of γ (0.5, 0.8, 1.0).
Source : After Oli et al . (2017).
Of those elasticities, it is encouraging, first, that the elasticity for the unknown survival rate, γ, is low, indicating that our conclusions are not strongly dependent on our assumptions about γ. Next, it is apparent from Figure 4.19b that infected adults had a reduced survival rate (down 14.5%), and it is for this reason that the elasticity values for the probability of transition of adults into the infected state were negative ( Figure 4.19c). However, these elasticities were especially low, indicating that R for the armadillo population would not be greatly affected by the infection rate. Rather, the parameter with an elasticity value indicating the greatest influence on R (approaching 0.5) was the survival rate of adults.
The distribution of nine‐banded armadillos is expanding northwards in the USA, and the incidence of leprosy in these populations is increasing drastically. The elasticity analysis suggests that leprosy itself will do little to halt the spread of armadillos. If their abundance is going to be controlled, adult survival is likely to be the most effective, as well as perhaps the most practical target.
Читать дальшеИнтервал:
Закладка:
Похожие книги на «Ecology»
Представляем Вашему вниманию похожие книги на «Ecology» списком для выбора. Мы отобрали схожую по названию и смыслу литературу в надежде предоставить читателям больше вариантов отыскать новые, интересные, ещё непрочитанные произведения.


Обсуждение, отзывы о книге «Ecology» и просто собственные мнения читателей. Оставьте ваши комментарии, напишите, что Вы думаете о произведении, его смысле или главных героях. Укажите что конкретно понравилось, а что нет, и почему Вы так считаете.