Michael Begon - Ecology
Здесь есть возможность читать онлайн «Michael Begon - Ecology» — ознакомительный отрывок электронной книги совершенно бесплатно, а после прочтения отрывка купить полную версию. В некоторых случаях можно слушать аудио, скачать через торрент в формате fb2 и присутствует краткое содержание. Жанр: unrecognised, на английском языке. Описание произведения, (предисловие) а так же отзывы посетителей доступны на портале библиотеки ЛибКат.
- Название:Ecology
- Автор:
- Жанр:
- Год:неизвестен
- ISBN:нет данных
- Рейтинг книги:5 / 5. Голосов: 1
-
Избранное:Добавить в избранное
- Отзывы:
-
Ваша оценка:
Ecology: краткое содержание, описание и аннотация
Предлагаем к чтению аннотацию, описание, краткое содержание или предисловие (зависит от того, что написал сам автор книги «Ecology»). Если вы не нашли необходимую информацию о книге — напишите в комментариях, мы постараемся отыскать её.
– now in full colour – offers students and practitioners a review of the ecological sciences.
The previous editions of this book earned the authors the prestigious ‘Exceptional Life-time Achievement Award’ of the British Ecological Society – the aim for the fifth edition is not only to maintain standards but indeed to enhance its coverage of Ecology.
In the first edition, 34 years ago, it seemed acceptable for ecologists to hold a comfortable, objective, not to say aloof position, from which the ecological communities around us were simply material for which we sought a scientific understanding. Now, we must accept the immediacy of the many environmental problems that threaten us and the responsibility of ecologists to play their full part in addressing these problems. This fifth edition addresses this challenge, with several chapters devoted entirely to applied topics, and examples of how ecological principles have been applied to problems facing us highlighted throughout the remaining nineteen chapters.
Nonetheless, the authors remain wedded to the belief that environmental action can only ever be as sound as the ecological principles on which it is based. Hence, while trying harder than ever to help improve preparedness for addressing the environmental problems of the years ahead, the book remains, in its essence, an exposition of the
of ecology. This new edition incorporates the results from more than a thousand recent studies into a fully up-to-date text.
Written for students of ecology, researchers and practitioners, the fifth edition of
is anessential reference to all aspects of ecology and addresses environmental problems of the future.
Ecology — читать онлайн ознакомительный отрывок
Ниже представлен текст книги, разбитый по страницам. Система сохранения места последней прочитанной страницы, позволяет с удобством читать онлайн бесплатно книгу «Ecology», без необходимости каждый раз заново искать на чём Вы остановились. Поставьте закладку, и сможете в любой момент перейти на страницу, на которой закончили чтение.
Интервал:
Закладка:
Of all the various resources required by plants, CO 2is the only one that is increasing on a global scale. This rise is strongly correlated with the increased rate of consumption of fossil fuels and the clearing of forests. As Loladze (2002) points out, while consequential changes to global climate may be controversial in some quarters, marked increases in CO 2concentration itself are not. High mixing rates in the atmosphere mean that these are changes that will affect all plants. Plants now are experiencing around a 30% higher concentration compared with the preindustrial period – effectively instantaneous on a geological timescale. Trees living now may experience a doubling in concentration over their lifetimes – effectively instantaneous on an evolutionary timescale.
changes in geological time
Putting this in a wider context, though, there is also evidence of large‐scale changes in atmospheric CO 2over much longer timescales. A range of models suggest that during the Triassic, Jurassic and Cretaceous periods (around 250–70 million years ago), atmospheric concentrations of CO 2were four to eight times greater than at present (and both lower and very much higher prior to that), falling after the Cretaceous from between 1500 and 3000 μl l −1to below 1000 μl l −1in the subsequent Eocene, Miocene and Pliocene, and fluctuating between 180 and 280 μl l −1during more recent glacial and interglacial periods (the last 400 000 years; Figure 3.20). The steady rise in CO 2since the Industrial Revolution is therefore a partial return to pre‐Pleistocene conditions, more than 2.5 million years ago.
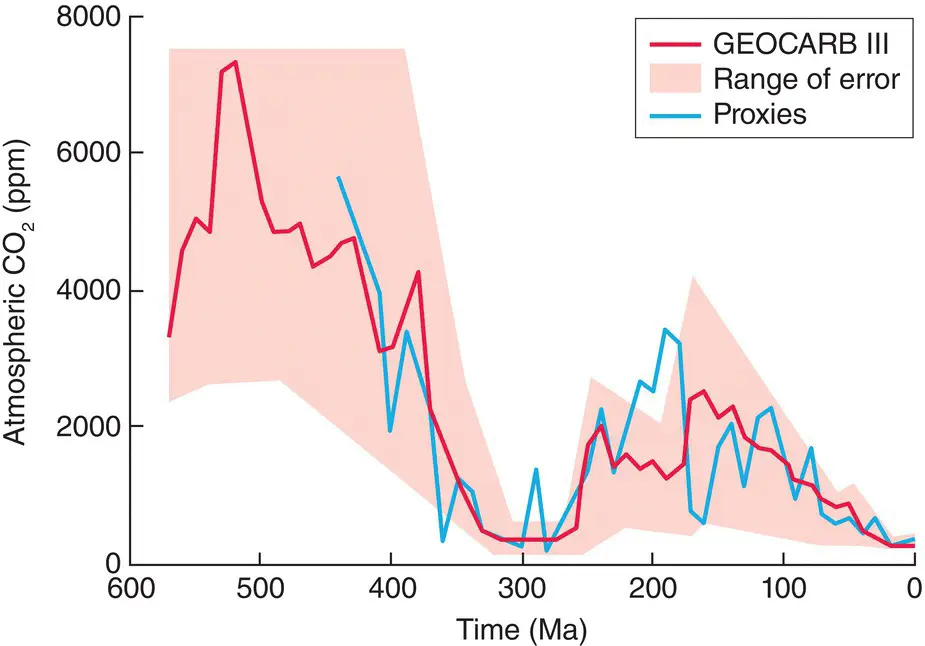
Figure 3.20 Estimates of atmospheric CO 2 concentrations over the past 600 million years (Ma).The red line (with estimated range of error in pink) is the output of the GEOCARB III model, which uses estimates of rates of geological weathering, emission and burial modified by a range of factors including global temperature and continental size. The blue line is the result of averaging four proxies of CO 2concentrations, including isotopic compositions of minerals and plankton and the distribution of stomata in plant leaves.
Source : After Royer et al . (2004).
what will be the consequences of current rises?
When other resources are present at adequate levels, additional CO 2scarcely influences the rate of photosynthesis of C 4plants but it increases the rate for C 3plants. As atmospheric concentrations continue to rise, therefore, it is no surprise that there has been considerable interest in the effects of higher CO 2concentrations on the productivity of individual plants and of whole crops, and natural communities including tropical rainforests (Lewis et al ., 2009). Earlier studies often used open‐top chambers into which CO 2was blown before escaping through the top, but increasingly and now predominantly, use is made of free air CO 2enrichment facilities (FACE – Figure 3.21) in which a ring of pipes release CO 2, at a range of heights, into an otherwise unconstrained body of plants much larger than an open top chamber (often 8–30 m in diameter). A computer‐controlled system is used to regulate the flow so as to maintain the target CO 2concentration in the FACE facility, typically 475–600 ppm.
Reviews of FACE studies have consistently shown increases in photosynthetic rates in response to elevated CO 2concentrations ( Figure 3.21a), and these responses have been markedly greater in C 3than in C 4plants ( Figure 3.21b), as predicted. Elevations in photosynthetic rates have also often been translated into increases in yield, though it is striking that such effects are more marked under the more natural conditions of a FACE facility than in open top chambers ( Figure 3.21c).
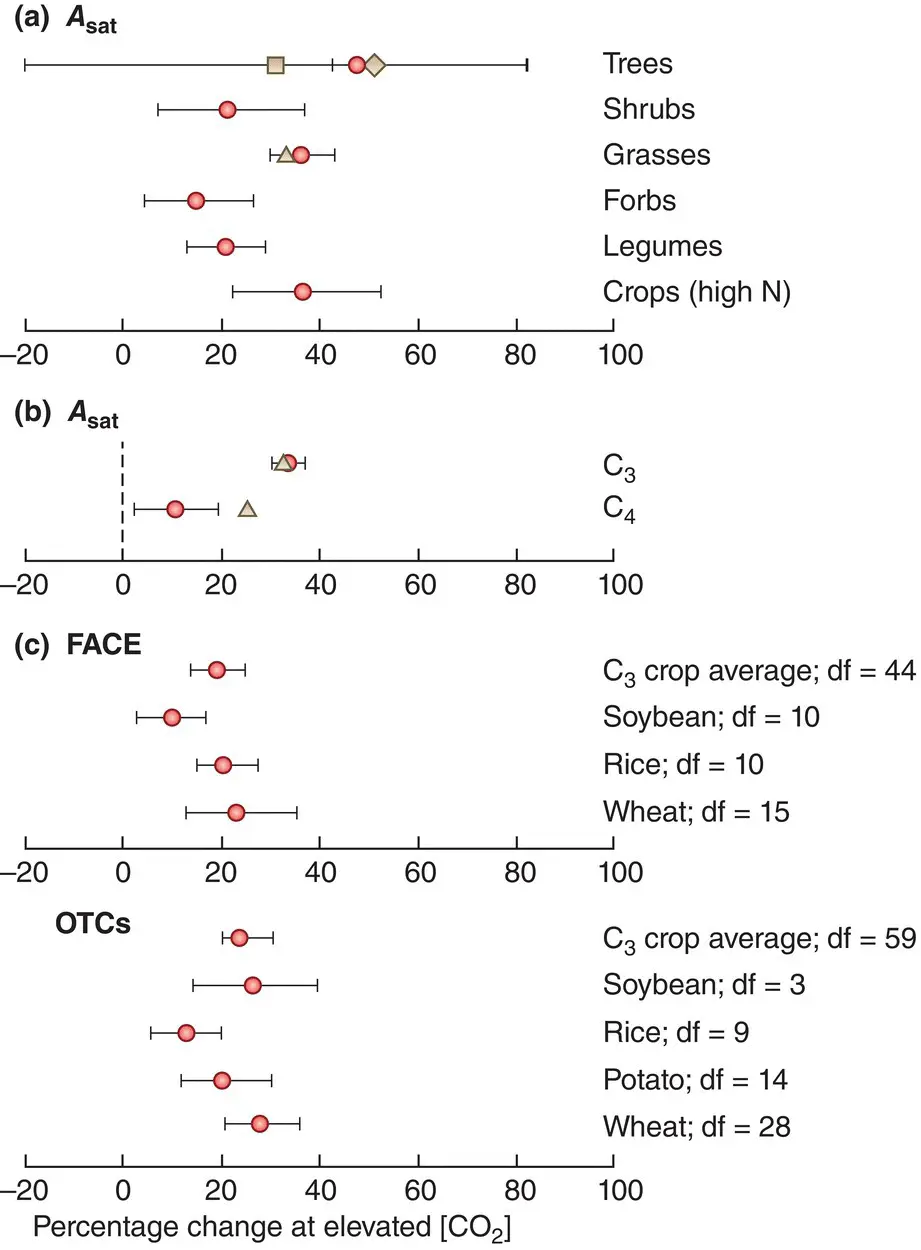
Figure 3.21 Photosynthetic activity is increased by enhanced CO 2 concentrations in FACE experiments.(a) Mean responses from meta‐analyses of light‐saturated CO 2uptake ( A sat), a measure of photosynthetic activity, to enhanced CO 2concentrations ([CO 2]) in free air CO 2enrichment facilities (FACE) experiments, for a variety of plant groups. Red symbols are from the current meta‐analysis, brown symbols from previous meta‐analyses. (b) Mean responses from these meta‐analyses of light‐saturated CO 2uptake ( A sat) to enhanced CO 2concentrations ([CO 2]) according to whether plants were C 3or C 4. (c) Mean responses from a meta‐analysis of the yields of various crops, as indicated, to enhanced CO 2concentrations ([CO 2]) in FACE experiments and open top chambers (OTCs). Bars are 95% CIs in all parts.
Source : (a, b) After Ainsworth & Long (2005). (c) After Bishop et al . (2014).
Such responses are in part simply a reflection of a greater availability of resource (CO 2), but there is likely to be an additional effect, especially in C 3plants, resulting from a reduced need for stomatal opening and the consequent reduction in water loss. This reduction in stomatal conductance has indeed been observed, at least in crops and especially under drought conditions ( Figure 3.22a). This in turn suggests that such increases in yield at higher CO 2concentrations should themselves be higher when there is reduced availability of water, since this is when the benefits of conserving water will be greatest. This, too, has been confirmed ( Figure 3.22b).
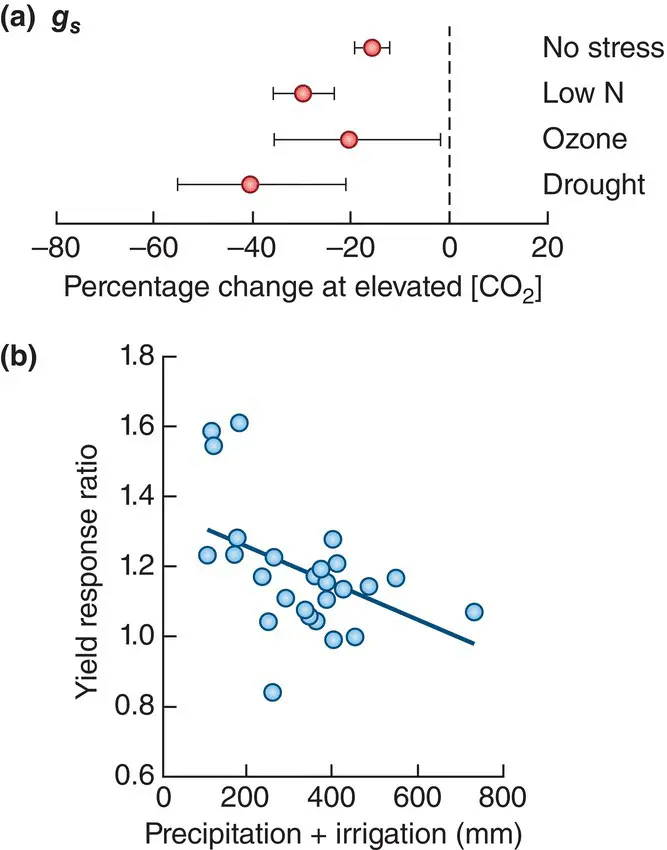
Figure 3.22 Stomatal conductance is decreased by enhanced CO 2 concentrations, leading to increased yields especially when water is scarce.(a) Mean responses from the meta‐analysis in Figure 3.21c of stomatal conductance ( g s) to enhanced CO 2concentrations ([CO 2]) in free air CO 2enrichment facilities (FACE) experiments with crop plants, classified according to different additional treatments. Bars are 95% CIs. (b) The significant negative relationship of the yield increases in Figure 3.21c to the level of water availability ( y = 1.36 – 0.0005x; r 2= 0.24; P = 0.009).
Source : After Bishop et al . (2014).
We should not be tempted by these general patterns, however, into thinking that responses to elevated CO 2concentrations will be straightforward and predictable. The results of a 20‐year FACE experiment, in which the responses of C 3and C 4grasses were compared, are shown in Figure 3.23. For the first 12 years of the experiment, the results were as might conventionally have been predicted. There was a marked increase in biomass in C 3plots compared with those experiencing ambient CO 2, but no such response in C 4plots. However, this pattern was reversed in the subsequent eight years ( Figure 3.23a). The explanation for this reversal is uncertain, but it is associated with a shifting balance in the effect of CO 2enhancement on the availability of nitrogen in the soils of the contrasting plots. The effect was positive initially in the C 3plots (more nitrogen available) but became increasingly negative, and was negative initially in the C 4plots but became increasingly positive ( Figure 3.23b). And overall in the experiment, positive effects of CO 2enhancement on nitrogen availability gave rise to positive effects on biomass. The authors of the study admit, frustratingly, that the underlying basis of these nitrogen cycling responses remains an open question. But these results do at least remind us, first, that short‐term responses may be misleading in predicting the consequences of what are likely to be long‐term trends, and also, that the changing availability of one resource may, within the community as a whole, give rise to altered levels of other resources with equally profound consequences.
Читать дальшеИнтервал:
Закладка:
Похожие книги на «Ecology»
Представляем Вашему вниманию похожие книги на «Ecology» списком для выбора. Мы отобрали схожую по названию и смыслу литературу в надежде предоставить читателям больше вариантов отыскать новые, интересные, ещё непрочитанные произведения.


Обсуждение, отзывы о книге «Ecology» и просто собственные мнения читателей. Оставьте ваши комментарии, напишите, что Вы думаете о произведении, его смысле или главных героях. Укажите что конкретно понравилось, а что нет, и почему Вы так считаете.