Francesca Lazzeri - Machine Learning for Time Series Forecasting with Python
Здесь есть возможность читать онлайн «Francesca Lazzeri - Machine Learning for Time Series Forecasting with Python» — ознакомительный отрывок электронной книги совершенно бесплатно, а после прочтения отрывка купить полную версию. В некоторых случаях можно слушать аудио, скачать через торрент в формате fb2 и присутствует краткое содержание. Жанр: unrecognised, на английском языке. Описание произведения, (предисловие) а так же отзывы посетителей доступны на портале библиотеки ЛибКат.
- Название:Machine Learning for Time Series Forecasting with Python
- Автор:
- Жанр:
- Год:неизвестен
- ISBN:нет данных
- Рейтинг книги:3 / 5. Голосов: 1
-
Избранное:Добавить в избранное
- Отзывы:
-
Ваша оценка:
Machine Learning for Time Series Forecasting with Python: краткое содержание, описание и аннотация
Предлагаем к чтению аннотацию, описание, краткое содержание или предисловие (зависит от того, что написал сам автор книги «Machine Learning for Time Series Forecasting with Python»). Если вы не нашли необходимую информацию о книге — напишите в комментариях, мы постараемся отыскать её.
time series modeling with this indispensable resource
Machine Learning for Time Series Forecasting with Python Despite the centrality of time series forecasting, few business analysts are familiar with the power or utility of applying machine learning to time series modeling. Author Francesca Lazzeri, a distinguished machine learning scientist and economist, corrects that deficiency by providing readers with comprehensive and approachable explanation and treatment of the application of machine learning to time series forecasting.
Written for readers who have little to no experience in time series forecasting or machine learning, the book comprehensively covers all the topics necessary to:
Understand time series forecasting concepts, such as stationarity, horizon, trend, and seasonality Prepare time series data for modeling Evaluate time series forecasting models’ performance and accuracy Understand when to use neural networks instead of traditional time series models in time series forecasting
is full real-world examples, resources and concrete strategies to help readers explore and transform data and develop usable, practical time series forecasts.
Perfect for entry-level data scientists, business analysts, developers, and researchers, this book is an invaluable and indispensable guide to the fundamental and advanced concepts of machine learning applied to time series modeling.
Machine Learning for Time Series Forecasting with Python — читать онлайн ознакомительный отрывок
Ниже представлен текст книги, разбитый по страницам. Система сохранения места последней прочитанной страницы, позволяет с удобством читать онлайн бесплатно книгу «Machine Learning for Time Series Forecasting with Python», без необходимости каждый раз заново искать на чём Вы остановились. Поставьте закладку, и сможете в любой момент перейти на страницу, на которой закончили чтение.
Интервал:
Закладка:
Training time: Training time is the amount of time needed to train a machine learning model. Training time is often closely tied to overall model accuracy. In addition, some algorithms are more sensitive to the number of data points than others. When time is limited, it can drive the choice of algorithm, especially when the data set is large.
Linearity: Linearity is mathematical function that identifies a specific relationship between data points of a data set. This mathematical relationship means that data points can be graphically represented as a straight line. Linear algorithms tend to be algorithmically simple and fast to train. Different machine learning algorithms make use of linearity. Linear classification algorithms (such as logistic regression and support vector machines) assume that classes in a data set can be separated by a straight line. Linear regression algorithms assume that data trends follow a straight line.
Number of parameters: Machine learning parameters are numbers (such as the number of error tolerance, the number of iterations, the number of options between variants of how the algorithm behaves) that data scientists usually need to manually select in order to improve an algorithm's performance ( aka.ms/AlgorithmSelection). The training time and accuracy of the algorithm can sometimes be quite sensitive to getting just the right settings. Typically, algorithms with large numbers of parameters require the most trial and error to find a good combination. While this is a great way to make sure you've spanned the parameter space, the time required to train a model increases exponentially with the number of parameters. The upside is that having many parameters typically indicates that an algorithm has greater flexibility. It can often achieve very good accuracy, provided you can find the right combination of parameter settings ( aka.ms/AlgorithmSelection).
Number of features: Features are properties of a phenomenon based on which data scientists would like to predict results. A large number of features can overload some learning algorithms, making training time long. Data scientists can perform techniques such as feature selection and dimensionality reduction to reduce the number and the dimensionality of the features they have to work with. While both methods are used for reducing the number of features in a data set, there is an important difference:Feature selection is simply selecting and excluding given features without changing them.Dimensionality reduction transforms features into a lower dimension.
With these important machine learning concepts in mind, you can now learn how to reshape your forecasting scenario as a supervised learning problem and, as a consequence, get access to a large portfolio of linear and nonlinear machine learning algorithms
Time series data can be expressed as a supervised learning problem: data scientists usually transform their time series data sets into a supervised learning by exploiting previous time steps and using them as input and then leveraging the next time step as output of the model. Figure 1.8shows the difference between an original time series data set and a data set transformed as a supervised learning.
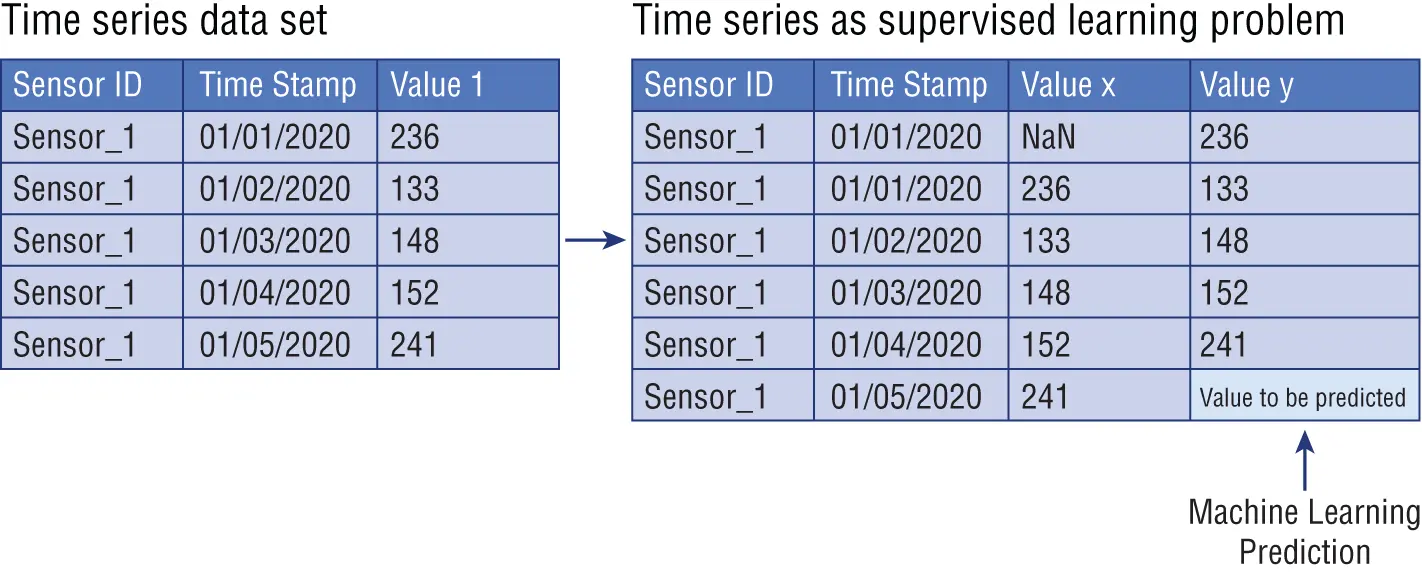
Figure 1.8 :Time series data set as supervised learning problem
We can summarize some observations from Figure 1.8in the following way:
The value of Sensor_1 at prior time step (for example, 01/01/2020) becomes the input (Value x) in a supervised learning problem.
The value of Sensor_1 at subsequent time step (for example, 01/02/2020) becomes the output (Value y) in a supervised learning problem.
It is important to note that the temporal order between the Sensor_1 values needs to be maintained during the training of machine learning algorithms.
By performing this transformation on our time series data, the resulting supervised learning data set will show an empty value (NaN) in the first row of Value x. This means that no prior Value x can be leveraged to predict the first value in the time series data set. We suggest removing this row because we cannot use it for our time series forecasting solution.
Finally, the subsequent next value to predict for the last value in the sequence is unknown: this is the value that needs to be predicted by our machine learning model.
How can we turn any time series data set into a supervised learning problem? Data scientists usually exploit the values of prior time steps to predict the subsequent time step value by using a statistical method, called the sliding window method . Once the sliding window method is applied and a time series data set is converted, data scientists can use can leverage standard linear and nonlinear machine learning methods to model their time series data.
Previously and in Figure 1.8, I used examples of univariate time series : these are data sets where only a single variable is observed at each time, such as energy load at each hour. However, the sliding window method can be applied to a time series data set that includes more than one historical variable observed at each time step and when the goal is to predict more than one variable in the future: this type of time series data set is called multivariate time series (I will discuss this concept in more detail later in this book).
We can reframe this time series data set as a supervised learning problem with a window width of one. This means that we will use the prior time step values of Value 1 and Value 2. We will also have available the next time step value for Value 1. We will then predict the next time step value of Value 2. As illustrated in Figure 1.9, this will give us three input features and one output value to predict for each training pattern.
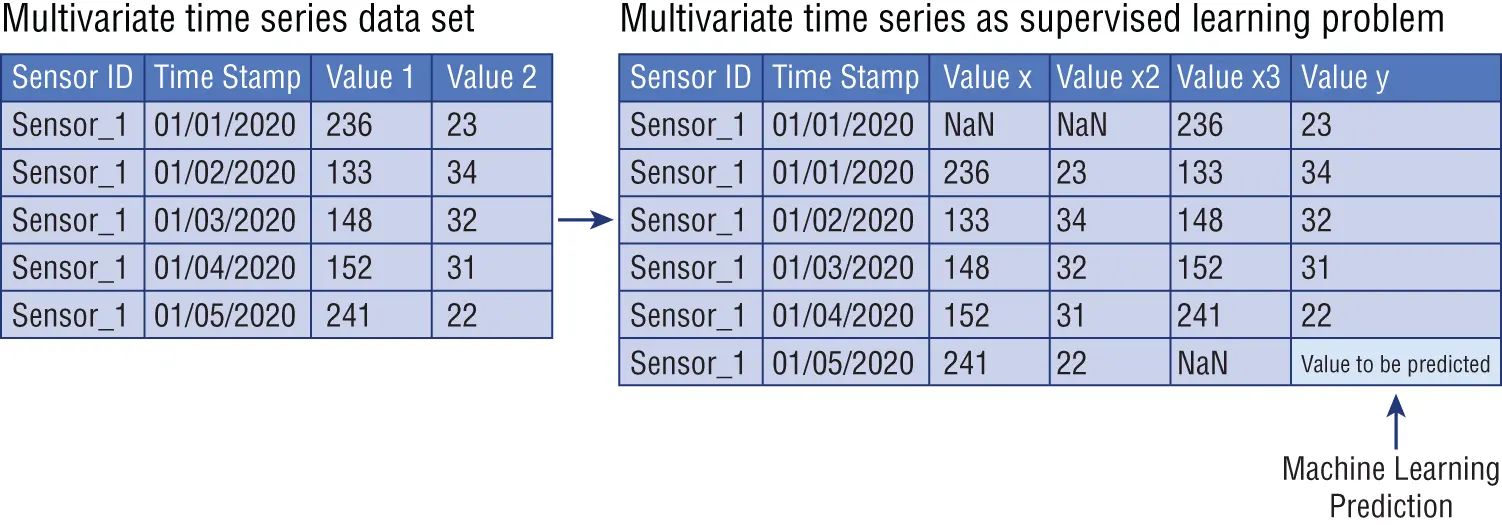
Figure 1.9 :Multivariate time series as supervised learning problem
In the example of Figure 1.9, we were predicting two different output variables (Value 1 and Value 2), but very often data scientists need to predict multiple time steps ahead for one output variable. This is called multi-step forecasting . In multi-step forecasting, data scientists need to specify the number of time steps ahead to be forecasted, also called forecast horizon in time series. Multi-step forecasting usually presents two different formats:
One-step forecast: When data scientists need to predict the next time step (t + 1)
Multi-step forecast: When data scientists need to predict two or more (n) future time steps (t + n)
For example, demand forecasting models predict the quantity of an item that will be sold the following week and the following two weeks given the sales up until the current week. In the stock market, given the stock prices up until today one can predict the stock prices for the next 24 hours and 48 hours. Using a weather forecasting engine, one can predict the weather for the next day and for the entire week (Brownlee 2017).
The sliding window method can be applied also on a multi-step forecasting solution to transform it into a supervised learning problem. As illustrated in Figure 1.10, we can use the same univariate time series data set from Figure 1.8as an example, and we can structure it as a two-step forecasting data set for supervised learning with a window width of one (Brownlee 2017).
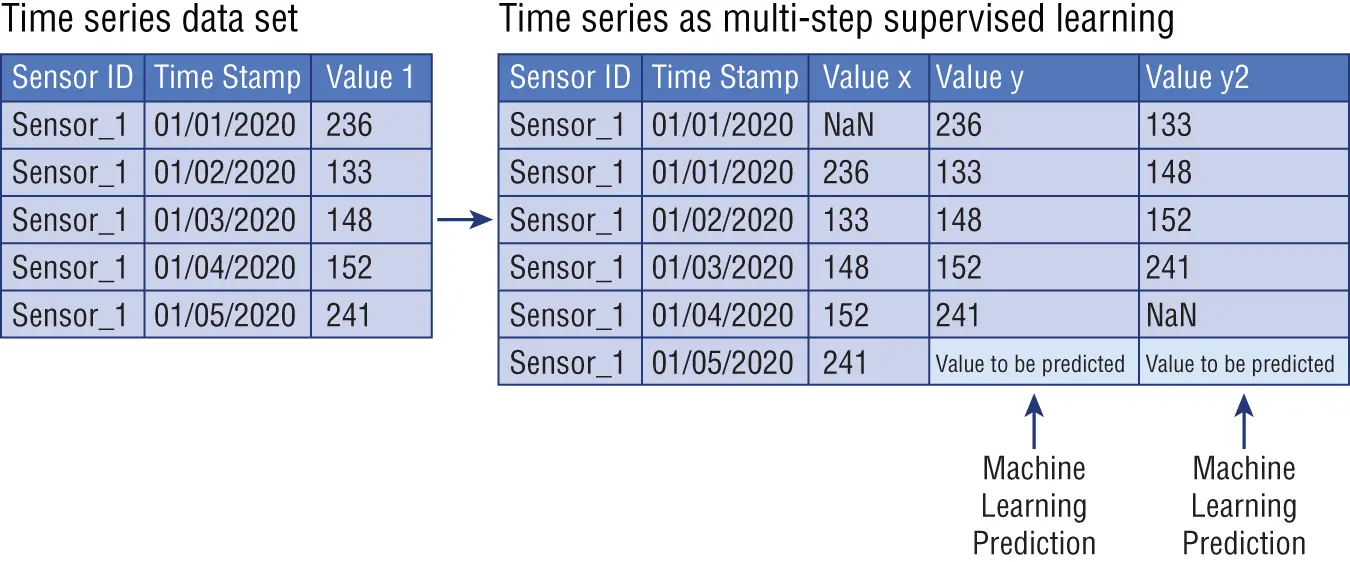
Figure 1.10 :Univariate time series as multi-step supervised learning
Читать дальшеИнтервал:
Закладка:
Похожие книги на «Machine Learning for Time Series Forecasting with Python»
Представляем Вашему вниманию похожие книги на «Machine Learning for Time Series Forecasting with Python» списком для выбора. Мы отобрали схожую по названию и смыслу литературу в надежде предоставить читателям больше вариантов отыскать новые, интересные, ещё непрочитанные произведения.


Обсуждение, отзывы о книге «Machine Learning for Time Series Forecasting with Python» и просто собственные мнения читателей. Оставьте ваши комментарии, напишите, что Вы думаете о произведении, его смысле или главных героях. Укажите что конкретно понравилось, а что нет, и почему Вы так считаете.