Malcolm J. Crocker - Engineering Acoustics
Здесь есть возможность читать онлайн «Malcolm J. Crocker - Engineering Acoustics» — ознакомительный отрывок электронной книги совершенно бесплатно, а после прочтения отрывка купить полную версию. В некоторых случаях можно слушать аудио, скачать через торрент в формате fb2 и присутствует краткое содержание. Жанр: unrecognised, на английском языке. Описание произведения, (предисловие) а так же отзывы посетителей доступны на портале библиотеки ЛибКат.

- Название:Engineering Acoustics
- Автор:
- Жанр:
- Год:неизвестен
- ISBN:нет данных
- Рейтинг книги:3 / 5. Голосов: 1
-
Избранное:Добавить в избранное
- Отзывы:
-
Ваша оценка:
Engineering Acoustics: краткое содержание, описание и аннотация
Предлагаем к чтению аннотацию, описание, краткое содержание или предисловие (зависит от того, что написал сам автор книги «Engineering Acoustics»). Если вы не нашли необходимую информацию о книге — напишите в комментариях, мы постараемся отыскать её.
Engineering Acoustics — читать онлайн ознакомительный отрывок
Ниже представлен текст книги, разбитый по страницам. Система сохранения места последней прочитанной страницы, позволяет с удобством читать онлайн бесплатно книгу «Engineering Acoustics», без необходимости каждый раз заново искать на чём Вы остановились. Поставьте закладку, и сможете в любой момент перейти на страницу, на которой закончили чтение.
Интервал:
Закладка:
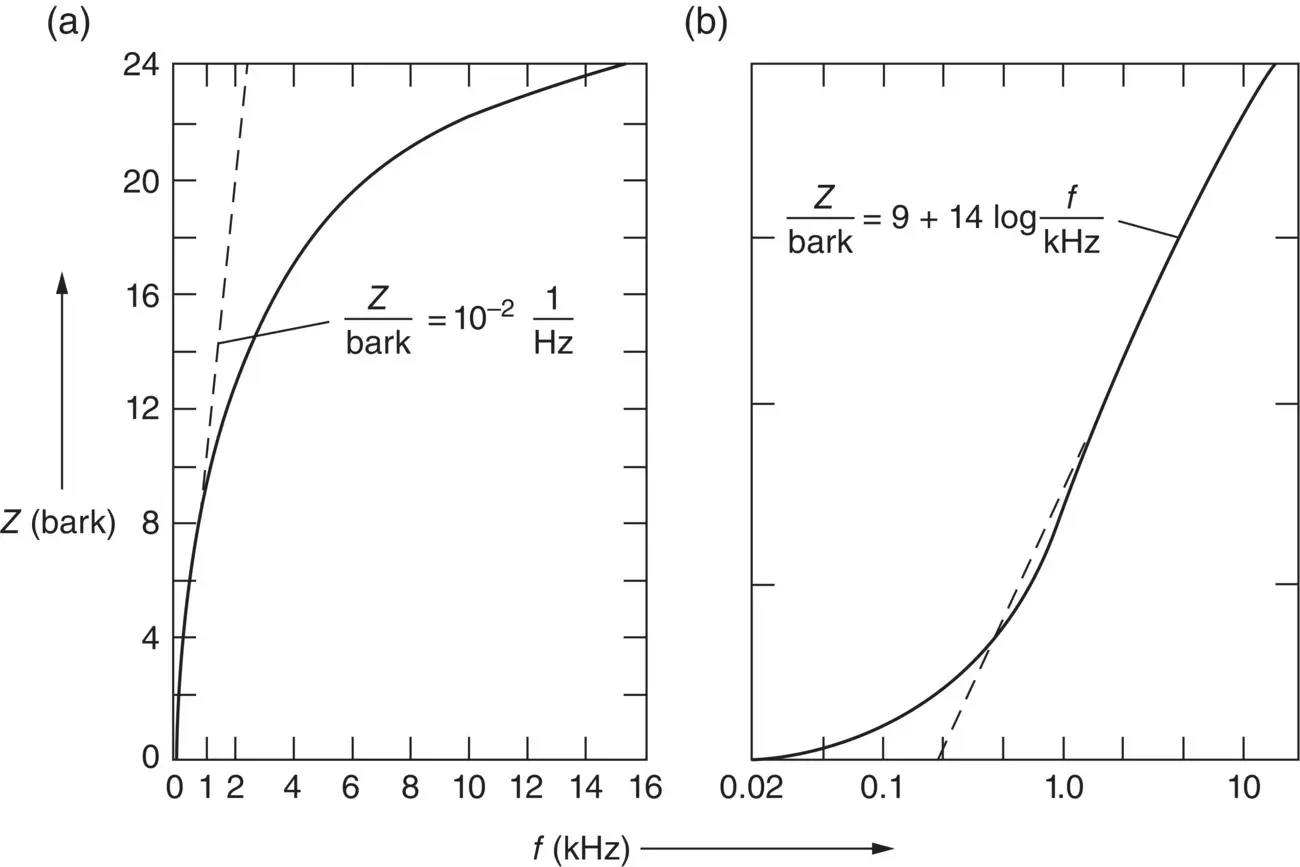
Figure 4.19 Relations between bark scale and frequency scale [17, 18].

Figure 4.20 Masking patterns [17, 18] of narrow‐band noises centered at different frequencies f m.
An approximate analytical expression for auditory frequency in barks as a function of auditory frequency in hertz is given by [43]
(4.4) 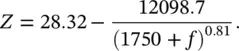
Care should be taken to note that the ear does not hear sounds at a fixed number of fixed center frequencies as might be suspected from Figure 4.20. Rather, at any frequency f mconsidered, the average ear has a given bandwidth.
Example 4.6
Convert f = 6 kHz into its corresponding value in bark.
Solution
Using Eq. (4.4), Z = 28.32 − 12098.7(6000 + 1750) −0.81= 28.32 − 12098.7(7.07 × 10 −4) = 28.32 − 8.56 = 19.76. This result can also be obtained from Figure 4.19.
4.3.8 Zwicker Loudness
The loudness of sounds was discussed in Sections 4.3.2and 4.3.5, where it was shown that A‐weighted sound pressure level measurements underestimate the loudness of broadband noise. (See Figure 4.16.) Methods to evaluate the loudness of broadband noise based on multiband frequency analysis have been devised by Stevens [44], Kryter [16], and Zwicker [12]. The Stevens method was originally based on octave band analysis, but Kryter's and Zwicker's methods are based on one‐third octave band analysis. Kryter's method has been standardized for aircraft certification noise measurements, while Zwicker's method has been standardized internationally and is most normally used to evaluate the loudness of many common sound sources including speech, music, machinery, and vehicles.
The procedure to evaluate loudness using Zwicker's method is shown in Figure 4.21. Figure 4.21a shows a narrow band centered at 1000 Hz, which corresponds to 8.5 bark. Figure 4.21b shows the narrow band of noise at 1000 Hz, including masking effects caused by spectral broadening in the cochlea due to inner ear mechanics. Figure 4.21c shows the specific loudness/critical band ratio pattern (sone/bark), known as the Zwicker diagram . The transition from the masking pattern in Figure 4.21b to the loudness pattern in Figure 4.21c can be considered to be obtained by simply taking the square root of the sound pressure or the fourth root of the sound intensity. The shaded area in Figure 4.21c is directly proportional to the perceived loudness. While Figure 4.21illustrates the spectral process of obtaining the perceived loudness of a sound by the Zwicker method, Figure 4.22shows the process including temporal effects. Figure 4.22a shows two impulses in the time domain, one with a broken line of 10‐ms duration and the other with a solid line of 100‐ms duration. As discussed earlier in connection with Figure 4.16, very short‐duration pulses of noise are perceived to be quieter than longer ones up to a duration of about 100–200 ms.
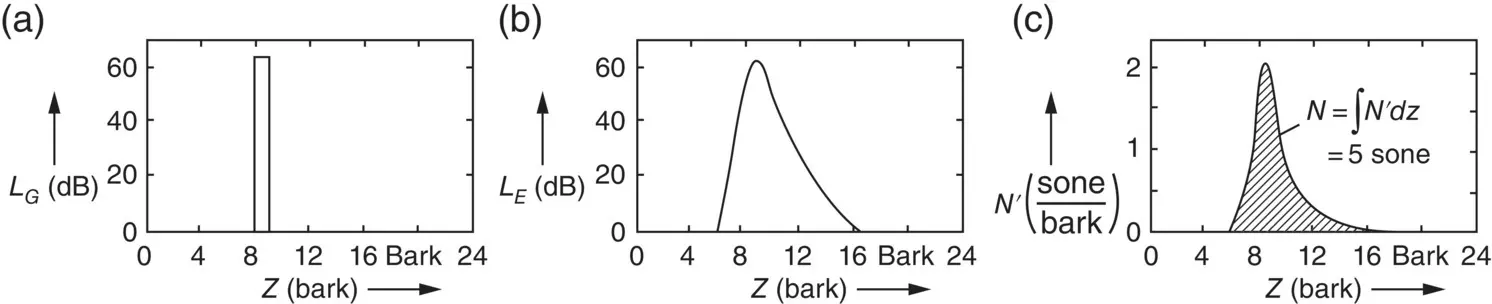
Figure 4.21 Schematic illustration of Zwicker's loudness model [17, 18].
Figure 4.22 Illustration of temporal effects in loudness processing [17, 18].
Figure 4.22is constructed by assuming that the hearing mechanism behaves like a parallel bank of 24 critical band filters. Figure 4.22b represents the processing of the loudness in each of the 24 channels of an empirical loudness meter used to model the hearing mechanism. Finally, Figure 4.22c shows the time dependence of the total loudness summed up over all 24 channels of the empirical loudness meter. Figure 4.22b shows that the short 10‐ms tone burst decays much more rapidly than the 100‐ms tone burst. The results shown in Figures 4.21and 4.22are important in evaluating the sound quality of machinery that has impulsive noise components, such as diesel engines and machines in which impacts occur.
4.3.9 Loudness Adaptation
The term loudness adaptation refers to the apparent decrease in loudness that occurs when a subject is presented with a sound signal for a long period of time [45]. The effect has been studied extensively by presenting tones for an extended period of time to one ear and then allowing the subject to adjust the level of a second comparison tone of the same frequency to the other ear. Such experiments have demonstrated that loudness adaptation of as much as 30 dB can be observed for very quiet sounds below 30 dB and much less for louder sounds of the order of 70 dB. However, other research has shown that loudness adaptation is reduced or even absent when binaural interactions are minimized. Recent research has shown that loudness adaptation is quite complicated. It varies from person to person. More adaptation occurs for very quiet sounds of about 30 dB and for high‐frequency tones than for low‐frequency tones or noise [19]. This phenomenon is obviously of interest to those concerned with sounds such as interior vehicle noise, that people experience over an extended period.
4.3.10 Empirical Loudness Meter
Figure 4.23shows a block diagram of an empirical Zwicker‐type dynamic loudness meter (DLM) that includes the spectral and temporal loudness processing portrayed in Figures 4.21and 4.22[22]. First, the spectral processing (1 and 2) shown in Figure 4.22using the critical band filter bank concept, upward spread of masking (7), and spectral summation (8) are illustrated. Second, the temporal processing discussed in relation to Figure 4.23is observed as shown in the blocks marked envelope extraction , postmasking , and temporal integration (see steps 3, 6, and 9.) Lastly and of most importance is step 5 (labeled loudness transformation ), which represents the fact that the loudness is assumed to be proportional to the square root of the sound pressure (or the fourth root of the sound intensity. See Figure 4.21c.).
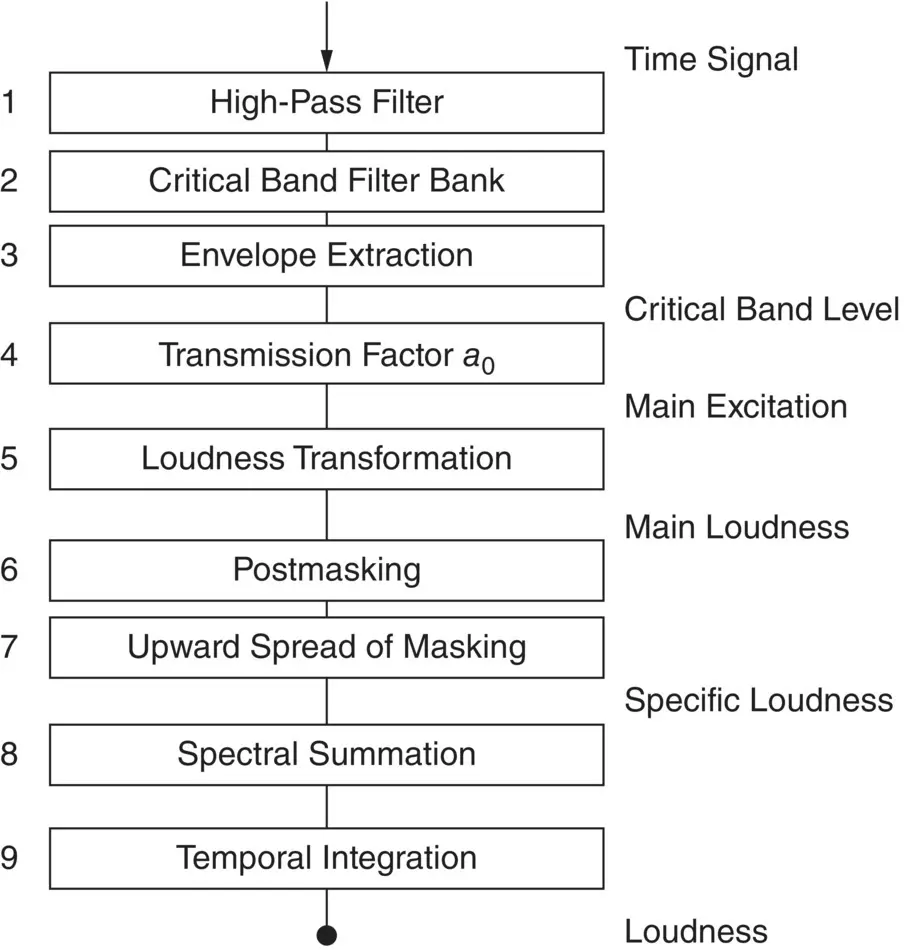
Figure 4.23 Block diagram of a dynamic loudness meter (DLM) [46].
One advantage of the DLM discussed and shown in Figure 4.23is that, by suitable modification of the DLM loudness transformation (step 5), the loudness perception of both normal hearing and hearing impaired subjects can be simulated [22]. This fact is important since the aging population in industrialized countries has suffered varying degrees of hearing impairment that should be allowed for in sound quality simulations. Some fraction of the younger population may have suffered mild to moderate hearing loss because of exposure to intense noise during recreational or leisure time activities [22].
Читать дальшеИнтервал:
Закладка:
Похожие книги на «Engineering Acoustics»
Представляем Вашему вниманию похожие книги на «Engineering Acoustics» списком для выбора. Мы отобрали схожую по названию и смыслу литературу в надежде предоставить читателям больше вариантов отыскать новые, интересные, ещё непрочитанные произведения.


Обсуждение, отзывы о книге «Engineering Acoustics» и просто собственные мнения читателей. Оставьте ваши комментарии, напишите, что Вы думаете о произведении, его смысле или главных героях. Укажите что конкретно понравилось, а что нет, и почему Вы так считаете.