Malcolm J. Crocker - Engineering Acoustics
Здесь есть возможность читать онлайн «Malcolm J. Crocker - Engineering Acoustics» — ознакомительный отрывок электронной книги совершенно бесплатно, а после прочтения отрывка купить полную версию. В некоторых случаях можно слушать аудио, скачать через торрент в формате fb2 и присутствует краткое содержание. Жанр: unrecognised, на английском языке. Описание произведения, (предисловие) а так же отзывы посетителей доступны на портале библиотеки ЛибКат.

- Название:Engineering Acoustics
- Автор:
- Жанр:
- Год:неизвестен
- ISBN:нет данных
- Рейтинг книги:3 / 5. Голосов: 1
-
Избранное:Добавить в избранное
- Отзывы:
-
Ваша оценка:
Engineering Acoustics: краткое содержание, описание и аннотация
Предлагаем к чтению аннотацию, описание, краткое содержание или предисловие (зависит от того, что написал сам автор книги «Engineering Acoustics»). Если вы не нашли необходимую информацию о книге — напишите в комментариях, мы постараемся отыскать её.
Engineering Acoustics — читать онлайн ознакомительный отрывок
Ниже представлен текст книги, разбитый по страницам. Система сохранения места последней прочитанной страницы, позволяет с удобством читать онлайн бесплатно книгу «Engineering Acoustics», без необходимости каждый раз заново искать на чём Вы остановились. Поставьте закладку, и сможете в любой момент перейти на страницу, на которой закончили чтение.
Интервал:
Закладка:
4.3.1 Hearing Envelope
Figure 4.5presents the auditory field for an average, normal young person who has not suffered any hearing loss or damage. The lower curve represents the hearing threshold, that is, the quietest audible sound at any frequency. The upper curve represents the discomfort threshold, that is, the sound pressure level at any frequency at which there is a sensation of discomfort and even pain in the ears. Speech is mainly in the frequency range of about 250–6000 Hz and at sound pressure levels between about 30–80 dB at 1–2 m (depending upon frequency). Of course, the sound pressure level of speech can approach 90 dB at about 0.2–0.3 m from someone if they are shouting loudly. The sound of vowels is mostly in the low‐frequency range from about 250 to 1000 Hz, while the sound of consonants is mainly in the higher frequency range of about 1000–6000 Hz. Music is spread over a somewhat greater frequency range and a greater dynamic range than speech. (The dynamic range represents the difference in levels between the lowest and highest sound pressure levels experienced.)

Figure 4.5 Human auditory field envelope.
4.3.2 Loudness Measurement
The way in which the brain interprets the neural pulses is still a matter for research. However, various experiments have been conducted on groups of people to determine people's average sensation of loudness, etc. We should stress that no one's hearing is exactly the same as any other and hence we must find statistical responses.
Figure 4.6shows equal loudness contours for pure tone sounds. Note that the lowest curve in Figure 4.6is labeled MAF (minimum audible field). This is the hearing threshold, the quietest sounds, on average, at any frequency that average young people can hear.

Figure 4.6 Equal loudness contours. The contours join the sound pressure levels of different frequency pure tones that are judged to be equally loud. The numbers on each contour are the loudness levels in phons.
We should note that there are two ways that we can measure the hearing threshold and the equal loudness contours. The first way is to present the listener with a free progressive wave field at a discrete frequency. This is the method which was used to obtain the results in Figure 4.6. Such measurements are normally made with the listener facing the source in an anechoic room where there are no reflections. The second way (which is used more frequently) is to present the listener with sounds played through earphones. There are some small differences in the results obtained by the two methods. The equal loudness contours are determined as follows. For the 60‐phon curve, the listener is first presented with a pure tone at 1000 Hz at a sound pressure level of 60 dB. Then he is presented with a pure tone at, for example, 500 Hz. The pure tones are presented alternately to the listener every few seconds. The level of the 500 Hz tone is adjustable and the listener is asked to adjust the level of the 500 Hz tone until the two tones sound equally as loud. The procedure is repeated with pure tones at other frequencies which are continually adjusted to sound equal in loudness to the 1000 Hz pure tones at 60 dB. The curve drawn through these points (when the result is averaged for a large number of people) is called the 60‐phon equal loudness contour. The 70‐phon contour is obtained by finding the sound pressure level of pure tones which seem equally as loud as 1000 Hz pure tone at 70 dB and so on. Finally, the MAF is the contour joining all pure tones which are just audible. Figure 4.6was determined for a group of young people with healthy ears in the age group 18–25, each person listening with both ears, facing the source, in a free progressive wave acoustic field.
We see from the equal loudness contours that the ear is most sensitive to sound at about 4000 Hz. This is mainly due to a quarter wavelength resonance in the ear canal at this frequency. The increase in sensitivity at 12 000 Hz is mainly caused by diffraction effects around the head.
The equal loudness contours are not flat as the frequency is changed. Notice at 1000 Hz we can just detect sounds of 4 dB, while at 100 Hz they must be 25 dB. Thus the intensity must be 21 dB higher at 100 Hz than 1000 Hz for us to detect a pure tone. This represents a 100‐fold increase in intensity or a 10‐fold increase in sound pressure amplitude. As the sound pressure level is increased, the equal loudness contours became flatter. A 40 dB tone at 1000 Hz appears equally as loud as a 51 dB tone at 100 Hz, an 11 dB increase. A 70 dB tone at 1000 Hz is as loud as a 75 dB tone at 100 Hz, only a 5 dB increase.
A further experiment has been performed on the loudness of pure tones. This experiment is to determine the increase in sound pressure level for a pure tone apparently to double in loudness. It has been found that for pure tones at 1000 Hz, when the sound pressure level is increased by about 10 dB, the sound appears twice as loud. Fletcher and Munson first commented on this in 1933 [11]. Alternatively we may say that since equal loudness contours join all pure tones with the same loudness levels in phons, then a doubling in loudness occurs when the loudness level increases by 10 phon. This relationship is shown in Figure 4.7and in the equation
(4.1) 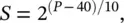
where S is loudness (sone) and P is loudness level (phon).
Figure 4.7 Relationship between the loudness (in sones) and the loudness level (in phons) of a sound.
Example 4.1
Equation (4.1)is quite useful since it converts the logarithmic loudness level, phon, into the more useful linear loudness measure, sone. We see from Eq. (4.1)or Figure 4.7that a loudness level of 40 phons has a loudness of 1 sone, a loudness level of 50 phons has a loudness of 2 sones, and a loudness level of 60 phons has a loudness of 4 sones and so on.
Example 4.2
Given three pure tones with the following frequencies and sound pressure levels: 100 Hz at 60 dB, 200 Hz at 70 dB, and 1000 Hz at 80 dB:
1 Calculate the total loudness in sones of these three pure tones.
2 Find the sound pressure level of a single 2000 Hz pure tone which has the same loudness as all the three pure tones combined.
Solution
1 The loudness level in phons of each tone is found from Figure 4.6and the corresponding loudness in sones is found from Eq. (4.1). Then we have that100 Hz @ 60 dB has P = 50 phons and S = 2 sones200 Hz @ 70 dB has P = 70 phons and S = 8 sones1000 Hz @ 80 dB has P = 80 phons and S = 16 sonesTherefore, the total loudness of these three pure tones is 2 + 8 + 16 = 26 sones.
2 The total loudness of the combined tones (26 sones) corresponds to a loudness level of P = 10log2(26) + 40. Since log2(26) = ln(26)/ln(2) = 4.7, then P = 87 phons.Now, from Figure 4.6we observe that a pure tone of 2000 Hz and loudness level of 87 phons has a sound pressure level of 82 dB.
So far we have discussed the loudness of pure tones. However, many of the noises we experience, although they may contain pure tones, are predominantly broadband. Similar loudness rating schemes have been worked out for broadband noise. In 1958–1960, Zwicker [12], taking into account masking effects (see later discussion in Section 4.3.3), devised a graphical method to compute the loudness of a broadband noise. It should be noted that Zwicker's method can be used both for diffuse and free field conditions and for broadband noise even when pronounced pure tones are present. However, the method is somewhat time‐consuming and involves measuring the area under a curve. It has been well described elsewhere [13].
Читать дальшеИнтервал:
Закладка:
Похожие книги на «Engineering Acoustics»
Представляем Вашему вниманию похожие книги на «Engineering Acoustics» списком для выбора. Мы отобрали схожую по названию и смыслу литературу в надежде предоставить читателям больше вариантов отыскать новые, интересные, ещё непрочитанные произведения.


Обсуждение, отзывы о книге «Engineering Acoustics» и просто собственные мнения читателей. Оставьте ваши комментарии, напишите, что Вы думаете о произведении, его смысле или главных героях. Укажите что конкретно понравилось, а что нет, и почему Вы так считаете.