Data Analytics in Bioinformatics
Здесь есть возможность читать онлайн «Data Analytics in Bioinformatics» — ознакомительный отрывок электронной книги совершенно бесплатно, а после прочтения отрывка купить полную версию. В некоторых случаях можно слушать аудио, скачать через торрент в формате fb2 и присутствует краткое содержание. Жанр: unrecognised, на английском языке. Описание произведения, (предисловие) а так же отзывы посетителей доступны на портале библиотеки ЛибКат.
- Название:Data Analytics in Bioinformatics
- Автор:
- Жанр:
- Год:неизвестен
- ISBN:нет данных
- Рейтинг книги:5 / 5. Голосов: 1
-
Избранное:Добавить в избранное
- Отзывы:
-
Ваша оценка:
Data Analytics in Bioinformatics: краткое содержание, описание и аннотация
Предлагаем к чтению аннотацию, описание, краткое содержание или предисловие (зависит от того, что написал сам автор книги «Data Analytics in Bioinformatics»). Если вы не нашли необходимую информацию о книге — напишите в комментариях, мы постараемся отыскать её.
Data Analytics in Bioinformatics — читать онлайн ознакомительный отрывок
Ниже представлен текст книги, разбитый по страницам. Система сохранения места последней прочитанной страницы, позволяет с удобством читать онлайн бесплатно книгу «Data Analytics in Bioinformatics», без необходимости каждый раз заново искать на чём Вы остановились. Поставьте закладку, и сможете в любой момент перейти на страницу, на которой закончили чтение.
Интервал:
Закладка:
1.6 K-Nearest Neighbor
K-Nearest Neighbor belongs to the category of supervised classification algorithm and hence, needs labeled data for training [77, 78]. In this approach, the value of K is suggested by the user. It can be used for both the classification and regression approaches but the attributes must be known. By performing the KNN algorithm, it will give new data points according to the k-number or the closest data points.
In the heart disease dataset also, The Area under the ROC Curve (AUC) has been used. It is the most basic tool for judging the classifier’s performance in a medical decision making concerns [79–81]. It is a graphical plot for judging the diagnostic ability with the help of a binary classifier. The generated ROC curve for KNN on the heart disease dataset [41] is presented below in Figure 1.14.
In the above figure, the true positive rate (probability of detection) is mentioned on the Y-axis, and on the x-axis, the false positive rate (probability of false alarm) is mentioned. The False Positive rate depicts the unit proportion with a known negative condition for which the predicted condition is positive.
The Area under the ROC Curve (AUC) of K-nearest neighbor is performed on the heart disease dataset [41] in python (Google Colab) and shown below in Table 1.5.
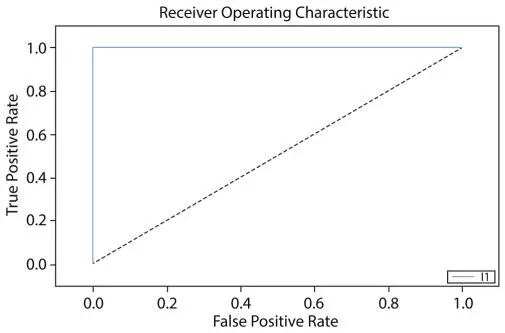
Figure 1.14ROC curve for k-nearest neighbor.
Table 1.5AUC: K-nearest neighbor.
| Parameter | Data | Value | Result |
| The area under the ROC Curve (AUC) | Training Data | 1.0000000 | Outstanding |
| Test Data | 1.0000000 | Outstanding | |
| Index: 0.5: No Discriminant, 0.6–0.8: Can be considered accepted, 0.8–0.9: Excellent, >0.9: Outstanding |
The obtained value of Training Data is 1.0000000 that attains an outstanding remark and the value of the testing data is 1.0000000 that attains an outstanding remark in the AUC score. The result shows that KNN performs outstandingly on the dataset.
1.7 Decision Trees
Decision Tree is a form of supervised machine learning and was invented by William Belson in the year 1959 [82]. It predicts the response values by learning the decision rules that were derived from features [83–84]. They are good for evaluating the options. It is used in operation research and decision analysis. An example of Decision Trees considering a person is having heart disease or not is presented below in Figure 1.15 for easy understanding.
The above figure depicts the answer to the Question “A person having Heart Disease or not?” by concerning various conditions and reaching a conclusion. Initially, it is checked that a person having chest pain or not. If yes, then it is checked that the person has high blood pressure or not. If the blood pressure if high or even low, then the person is suffering from heart disease. If the person doesn’t have chest pain then he is not suffering from heart disease. After implementing the Decision tree on the heart disease dataset [41] the AUC values are generated and presented in Table 1.6. The implementation was done in Python (Google Colab).
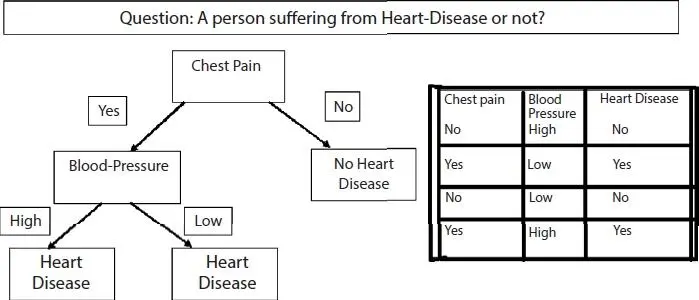
Figure 1.15Decision tree.
Table 1.6AUC: Decision trees.
| Parameter | Data | Value | Result |
| The area under the ROC Curve (AUC) | Training Data | 0.9588996 | Outstanding |
| Test Data | 0.9773333 | Outstanding | |
| Index: 0.5: No Discriminant, 0.6–0.8: Can be considered accepted, 0.8–0.9: Excellent, >0.9: Outstanding |
The obtained value of Training Data is 0.9588996 that attains an outstanding remark and the value of the testing data is 0.9773333 that attains an outstanding remark in the AUC score. The result indicates that the decision tree model performs outstandingly on the heart disease dataset.
1.8 Support Vector Machines
The original Support Vector Machine (SVM) algorithm was invented by Vladimir N. Vapnik & Alexey Ya. Chervonenkis in 1963 [85]. In machine learning, the Support Vector Classifier fits the data that the user provides, and returns the best-fit hyper-plane that categorizes the data. After getting the hyperplane, the user can feed some features to the classifier to check the predicted class [86–87]. SVM is used for analyzing data that can be used for the process of regression or classification. Taking a similar example of the bifurcation of a person suffering from heart disease or not but giving it a more detailed view, it is depicted in Figure 1.16.
In the above figure, there is an illustration of Support Vector Machines that amalgamates the Hyperplane, Support Vectors, Maximum Margins, and Data Points in a single concept and belongs to either a person is suffering from heart disease or not. Support Vectors are the points that are present very close to the hyperplane and it affects the position and orientation. If they are removed then the position and orientation of the hyperplane will be altered and the maximum margin will also get affected [88–90]. The maximum margin is the distance/length between the nearest points to both classes. Here, Class 1 belongs to the person suffering from heart diseases and Class 2 belongs to the persons who are not suffering from heart diseases. After implementing SVM on the heart disease dataset [41] through python (Google Colab), it was observed that the generated AUC values presented in Table 1.7 show that the model performs outstandingly.
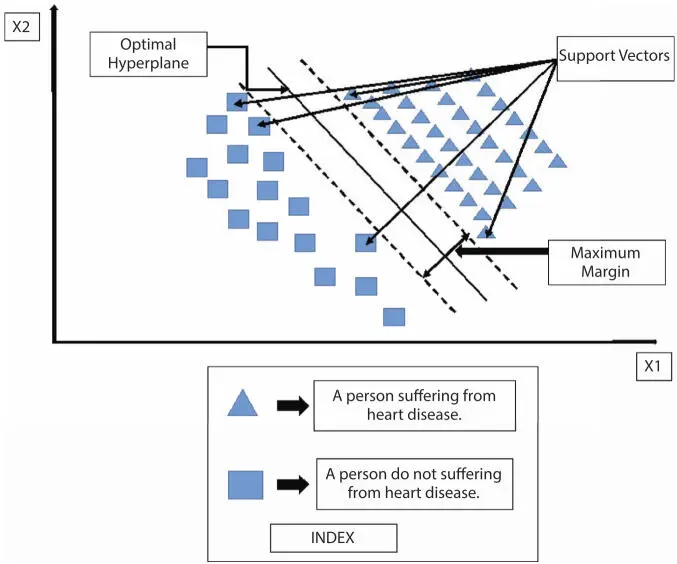
Figure 1.16Support vector machine.
Table 1.7AUC: Support vector machines.
| Parameter | Data | Value | Result |
| The area under the ROC Curve (AUC) | Training Data | 1.0000000 | Outstanding |
| Test Data | 0.9773333 | Outstanding | |
| Index: 0.5: No Discriminant, 0.6–0.8: Can be considered accepted, 0.8–0.9: Excellent, >0.9: Outstanding |
1.9 Neural Networks
The Artificial Neural Network (ANN) was invented by Frank Rosenblatt in 1958 [91]. They are inspired by biological neural networks. It is a collection of connected nodes that are called neurons but artificial. The Original goal of Artificial Neural network (ANN), is to solve the problems as the human brain does [92–93]. It does so by taking the inputs, processing them, and calculating the output. Neural Networks can learn by themselves. The outputs that are generated by the neural networks are not limited to the input attributes provided by the user. It doesn’t require a database, rather it stores the input in its network. The general form of an artificial neural network is shown below in Figure 1.17 and its detailed version is shown in Figure 1.18. Its other name is the connectionist system. This system learns by considering examples and performing tasks. Neural Networks has its applications in various fields such as:
Читать дальшеИнтервал:
Закладка:
Похожие книги на «Data Analytics in Bioinformatics»
Представляем Вашему вниманию похожие книги на «Data Analytics in Bioinformatics» списком для выбора. Мы отобрали схожую по названию и смыслу литературу в надежде предоставить читателям больше вариантов отыскать новые, интересные, ещё непрочитанные произведения.


Обсуждение, отзывы о книге «Data Analytics in Bioinformatics» и просто собственные мнения читателей. Оставьте ваши комментарии, напишите, что Вы думаете о произведении, его смысле или главных героях. Укажите что конкретно понравилось, а что нет, и почему Вы так считаете.