In the above figure, the patients that are suffering from Heart disease are represented by the triangle symbol, and those who are not, are represented by rectangle symbols. The hyperplane (partition) line depicts the bifurcation between these two classified entities. In general, there are four types of classification techniques. They are:
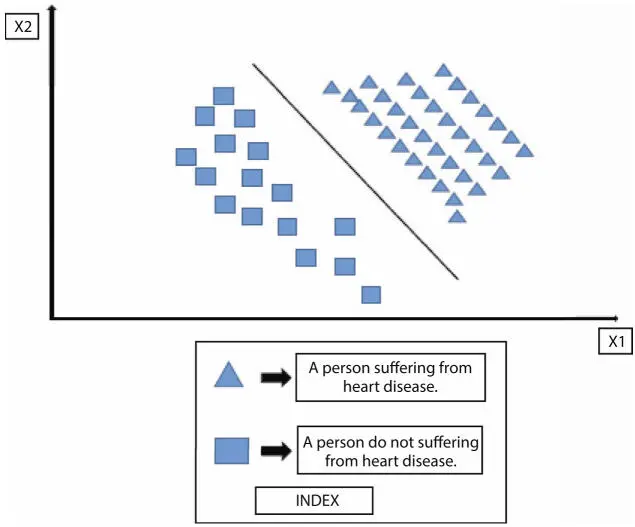
Figure 1.7Concept of classification.
Binary Classification: It considers the tasks of classification where the class labels are two, and the two classes consider one in the normal state and the other in the abnormal state [37].
Imbalanced Classification: It involves the tasks of classification where the examples are unequally distributed in the class [38].
Multi-label Classification: It involves the tasks of classification where the number of class labels is two or greater than two where for every example one or more than one class label may be predicted [39].
Multi-Class Classification: It involves the tasks of classification where the number of class labels is greater than two [40].
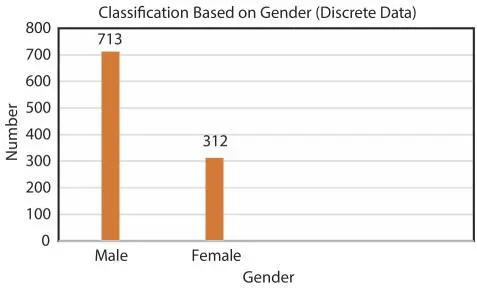
Figure 1.8Classification based on gender.
For Achieving the Classification approach more precisely, a heart disease dataset [41] has been used that comprises of a total of 1,025 people out of which 312 are females and 713 are males. A particular reason behind taking this dataset is that people are continuously suffering from heart diseases, this is so because people who consume alcohol excessively, consume oily and fast food and also inhale dangerous gases due to pollution. This Classification of gender is given below in Figure 1.8.
Regression is a very powerful type of statistical analysis. This is used for finding the strength as well as the character between one dependent variable and a series of independent variables [42–44]. This analysis provides the knowledge on the product that weather any updation in the future is possible or not. The operation of regression provides the ability to a researcher for identifying the best parameter of a topic that can be used for analysis. Also, it provides the parameters that are not to be used for analysis.
In the field of ML, Linear Regression is the most common type of regression analysis for the purpose of prediction [45]. In this process of statistical analysis, equations are made for identifying the useful and not-useful parameters. These are done by linear regression as well as multiple linear regression [46–49]. The representation of Linear Regression is presented in Equation (1.1)and the representation of Multiple Linear Regression is presented in Equation (1.2).
(1.1) 
(1.2) 
Where,
B is known as dependent variable
A or Aj∈k are independent variable
n is an intercept
q or qj∈k are slope variables
i is regression residual
k is any natural number.
For easy understanding, a case study on heart disease is discussed below. In this case study, with the help of the regression approach, a prediction was done whether a person has heart disease or not. Here, the dependent variable is the heart disease and the independent variables are cholesterol levels, blood pressure, etc. After analyzing the data, it was found that the patient has a problem in his heart which is presented below on a 2D plane in Figure 1.9.
The steps required for regression analysis are [50]:
Select the dependent & independent variables.
Explore the co-relation matrix along with the scatter plot.
Perform the Linear or Multiple Regression Operation.
Accord with the outliers along with the multi-collinearity.
Perform the t-test.
Handle the insignificant variables.

Figure 1.9Regression.
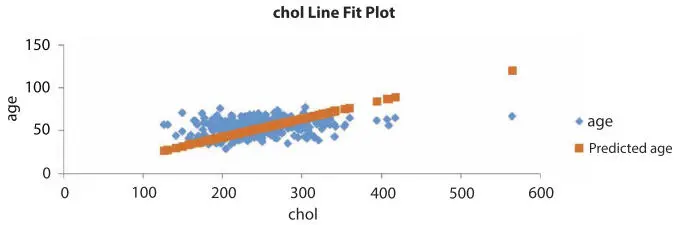
Figure 1.10Cholesterol line fit plot.
The Regression operation performed on the heart disease dataset concerning the age and cholesterol and got the following results as shown in Figure 1.10.
In the above figure, a line fit plot is mentioned that depicts the line of best fit. This line of best fit is known as the trend line. This trend line is based on a linear equation and try to present the standard cholesterol level of a general human w.r.t. the age. The plot has two axes that include a vertical axis depicting the age and the horizontal axis depicting the cholesterol values. The trend line could be linear, polynomial, or exponential as discussed in Refs. [51–53]. In the process of regression analysis on the heart disease dataset, the following numerical interpretation is obtained and presented in Table 1.1.
Where,
Multiple R (Co-relation Coefficient): It depicts the strength of a linear relationship between two variables i.e. age and cholesterol of a human. This value always lies between −1 and +1. The obtained value i.e. 0.972834634 indicated that there is a good relationship between age and cholesterol level.
R2: It is the coefficient of determination i.e. the goodness of fit. The obtained value is 0.946407225 which indicates that 95% of the values of the heart disease dataset fit the regression model.
Adjusted R2: This variable is an upgraded version of R2. This value tries to adjust the predictor number in the model. This value increases when any new term improves the performance of the model more than the expectation and viceversa. The obtained value i.e. 0.945430663 indicates that the model is not performing well so there is a need for modification in predictor number.
Standard Error: It measures the precision of the regression model, the smaller the number, the more accurate the results are. The value obtained is 12.7814549 which indicates that the results are near to accurate value. The Standard Error depicts the measure of how well the data has been approximated.
Table 1.1Regression statistics.
| Regression Statistics |
|
| Multiple R |
0.972834634 |
| R Square |
0.946407225 |
| Adjusted R Square |
0.945430663 |
| Standard Error |
12.7814549 |
| Observations |
1,025 |
1.4.1 Logistic Regression
Logistic Regression is a statistical model used for identifying the probability of a class with the help of binary dependent variables i.e. Yes or No. It indicates whether a class belongs to the Yes category or the No category. For example, after executing an event on an object the results maybe Win or Loss, Pass or Fail, Accept or Not-Accept, etc. The mathematical representation of the Logistic Regression model is done by two indicator variables i.e. 0 and 1. It is different from the Linear Regression technique as depicted in Ref. [54]. As logistic regression has its importance in the real-life classification problems as depicted in Refs. [55, 56], different fields like Medical Sciences, Social Sciences, ML are using this model in their various field of operations.
Читать дальше
