Stephen M. Rowland - Structural Analysis and Synthesis
Здесь есть возможность читать онлайн «Stephen M. Rowland - Structural Analysis and Synthesis» — ознакомительный отрывок электронной книги совершенно бесплатно, а после прочтения отрывка купить полную версию. В некоторых случаях можно слушать аудио, скачать через торрент в формате fb2 и присутствует краткое содержание. Жанр: unrecognised, на английском языке. Описание произведения, (предисловие) а так же отзывы посетителей доступны на портале библиотеки ЛибКат.
- Название:Structural Analysis and Synthesis
- Автор:
- Жанр:
- Год:неизвестен
- ISBN:нет данных
- Рейтинг книги:5 / 5. Голосов: 1
-
Избранное:Добавить в избранное
- Отзывы:
-
Ваша оценка:
Structural Analysis and Synthesis: краткое содержание, описание и аннотация
Предлагаем к чтению аннотацию, описание, краткое содержание или предисловие (зависит от того, что написал сам автор книги «Structural Analysis and Synthesis»). Если вы не нашли необходимую информацию о книге — напишите в комментариях, мы постараемся отыскать её.
As is explicit in the title, this book is concerned with both the analysis and synthesis of structural features. In this 4th edition, the focus of this popular manual has been broadened to include a range of new content and features, including:
Video content which demonstrates visually how to perform some of the more challenging structural geology techniques An acknowledgement of the increasing importance of environmental applications of structural geology – vital to students who may go on to pursue careers in the environmental sphere An increased emphasis on quantitative techniques, complete with descriptions of computer program applications Contingent with this quantitative emphasis, the book also outlines the limitations of such techniques, helping students to appropriately apply the techniques and evaluate their trustworthiness
is a renowned and widely recognized aid to students in grasping and mastering the techniques required in structural geology, and will find a home wherever the principles and practices of structural geology are taught.
Structural Analysis and Synthesis — читать онлайн ознакомительный отрывок
Ниже представлен текст книги, разбитый по страницам. Система сохранения места последней прочитанной страницы, позволяет с удобством читать онлайн бесплатно книгу «Structural Analysis and Synthesis», без необходимости каждый раз заново искать на чём Вы остановились. Поставьте закладку, и сможете в любой момент перейти на страницу, на которой закончили чтение.
Интервал:
Закладка:
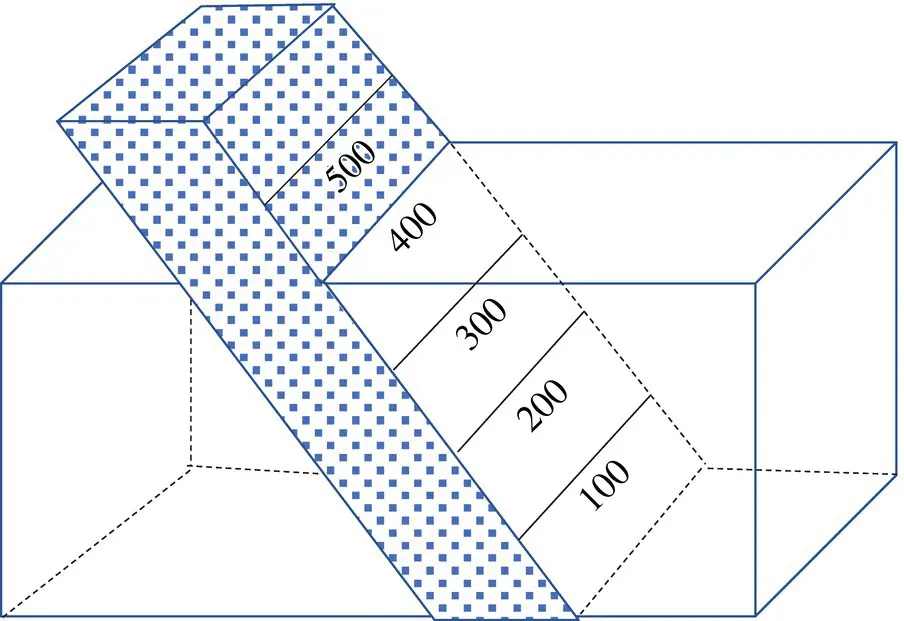
Figure 2.8 Example of structure contours on a structural surface.
Structure‐contour maps are commonly constructed from drill‐hole data. See Figure 2.9, for example, which shows a faulted dome. Notice that, unlike topographic contours, structure contours can terminate abruptly. Gaps in the map indicate normal faults, and overlaps indicate reverse faults.
There are various techniques for contouring elevations. In the case of structure contours, there are usually not enough data to produce an unequivocal map, so experienced interpretation is valuable. Although there are computer programs that draw contour lines between data points, such programs cannot substitute for the judgment of an experienced geologist.
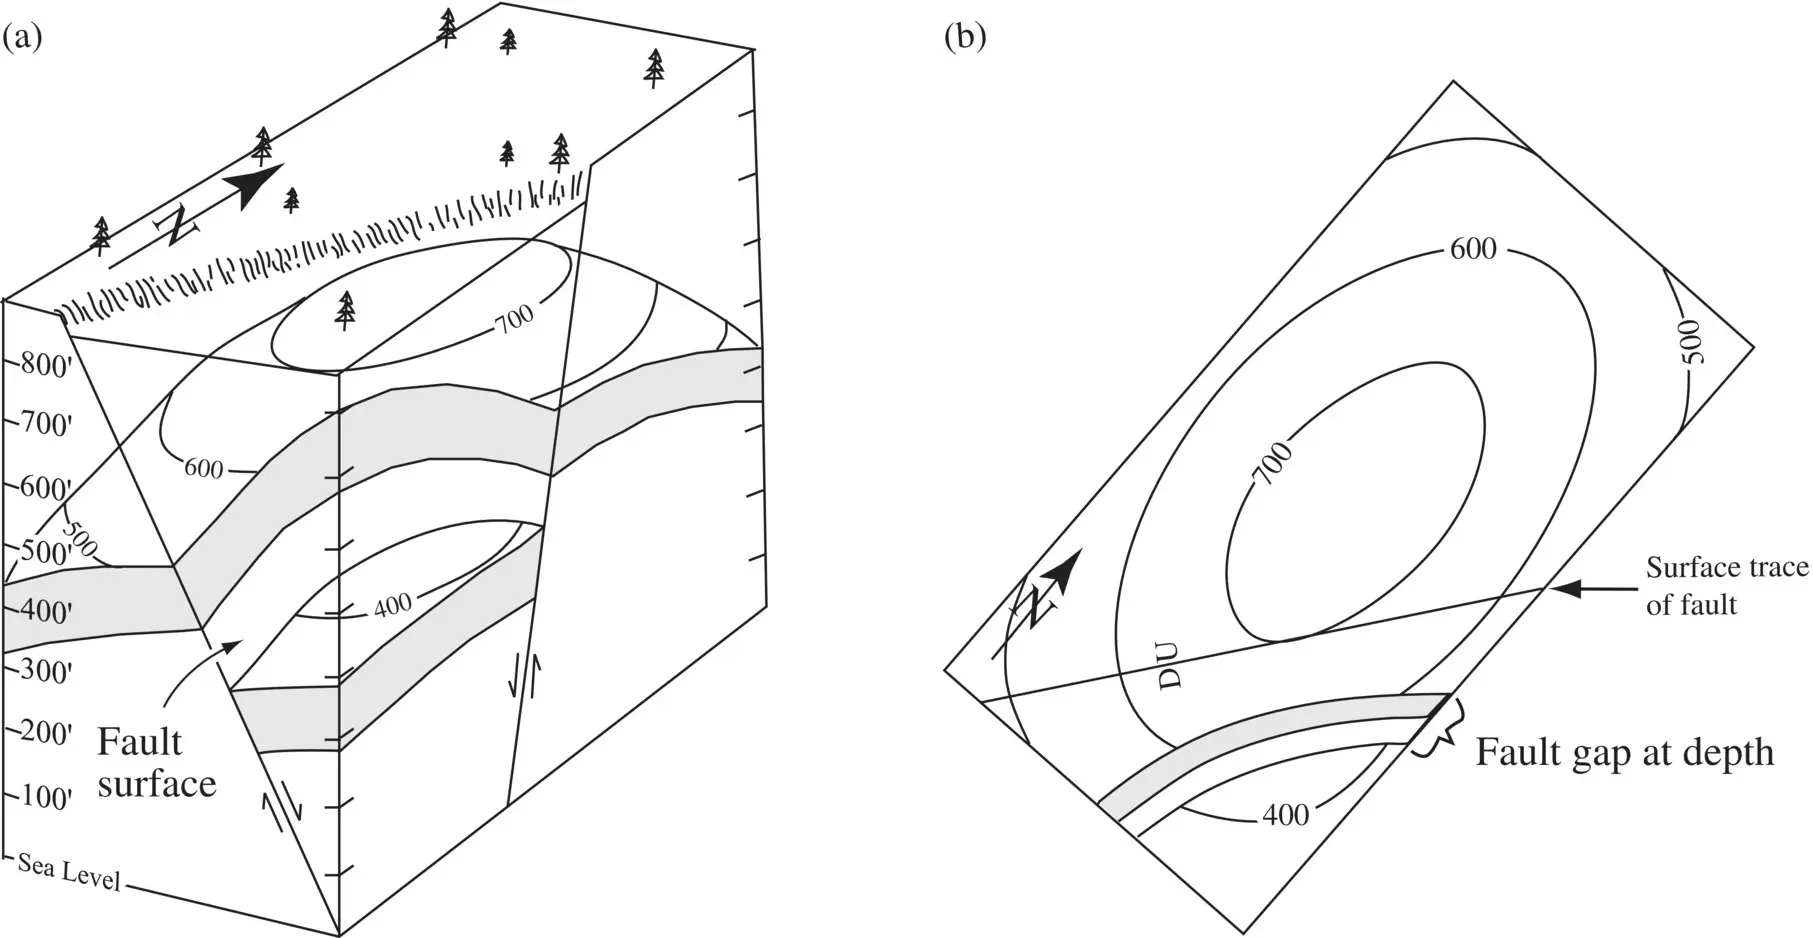
Figure 2.9 Block diagram (a) and structure‐contour map (b) of a subsurface faulted structural dome with contours on the top of shaded layer. D, down; U, up.
The Three‐Point Problem
 In many geologic situations, a planar bed or fault surface may crop out at several locations. If the elevations of three points on the surface are known, then the “three‐point problem” solution can be used to determine the orientation of the bed or fault (see technique in Video 2 at https://youtu.be/GBpY_Vi0zMw). Figure 2.10a shows three points (A, B, C) on a topographic map. These three points lie on the upper surface of a sandstone layer. The problem is to determine the attitude of the layer.
Step‐by‐Step Solution
1 Label the three known points A, B, C and their elevations on the map.
2 Draw lines connecting the three points and making a triangle.
3 One of the lines connects the highest to the lowest of the three points. Scale this line with a ruler and find the point along it that is equal in elevation to the point of intermediate elevation. In Figure 2.10b, point B has an elevation of 160 ft, so point B′, the point on the AC line that is equal in elevation to point B, lies 6/10 of the way from point A (100 ft) to point C (200 ft).
4 Draw a line from the intermediate elevation point to equivalent scaled elevation on the highest to lowest line. This is the strike line. In Figure 2.10c, there are two points, B and B′, of equal elevation lying in the plane of the bed and defining the strike of the plane. The structure‐contour line B–B′ is drawn, and the strike is measured with a protractor to be 048 (N48°E).
5 A series of strike lines can now be drawn on the map parallel to the strike line at selected regular elevations. Use the scaled line from highest to lowest elevation to determine the structural contours to be drawn ( Figure 2.10d). The spacing (d) between the structure contours of chosen elevation increments is replicated across the map to complete the structure contour map (See Figure 2.13a).
6 The spacing (d) reflects the angle of dip and the dip direction is perpendicular to strike in the direction of lower elevations. The dip angle can be determined trigonometrically like slope on a topographic map as shown for Figure 2.10and 2.13a:
More commonly, three‐point problems are applied to well data. The procedure is the same as described for surface exposures except the elevations used in the analysis are from depth below the surface. The elevation for each well is the drilling depth subtracted from the surface elevation to yield an elevation relative to sea level, the datum. There is a difference between solid elements such as beds, faults, or dikes and the water table which is commonly independent of them. The dip angle and its direction show the direction of groundwater movement and possibly some indication of relative velocity.
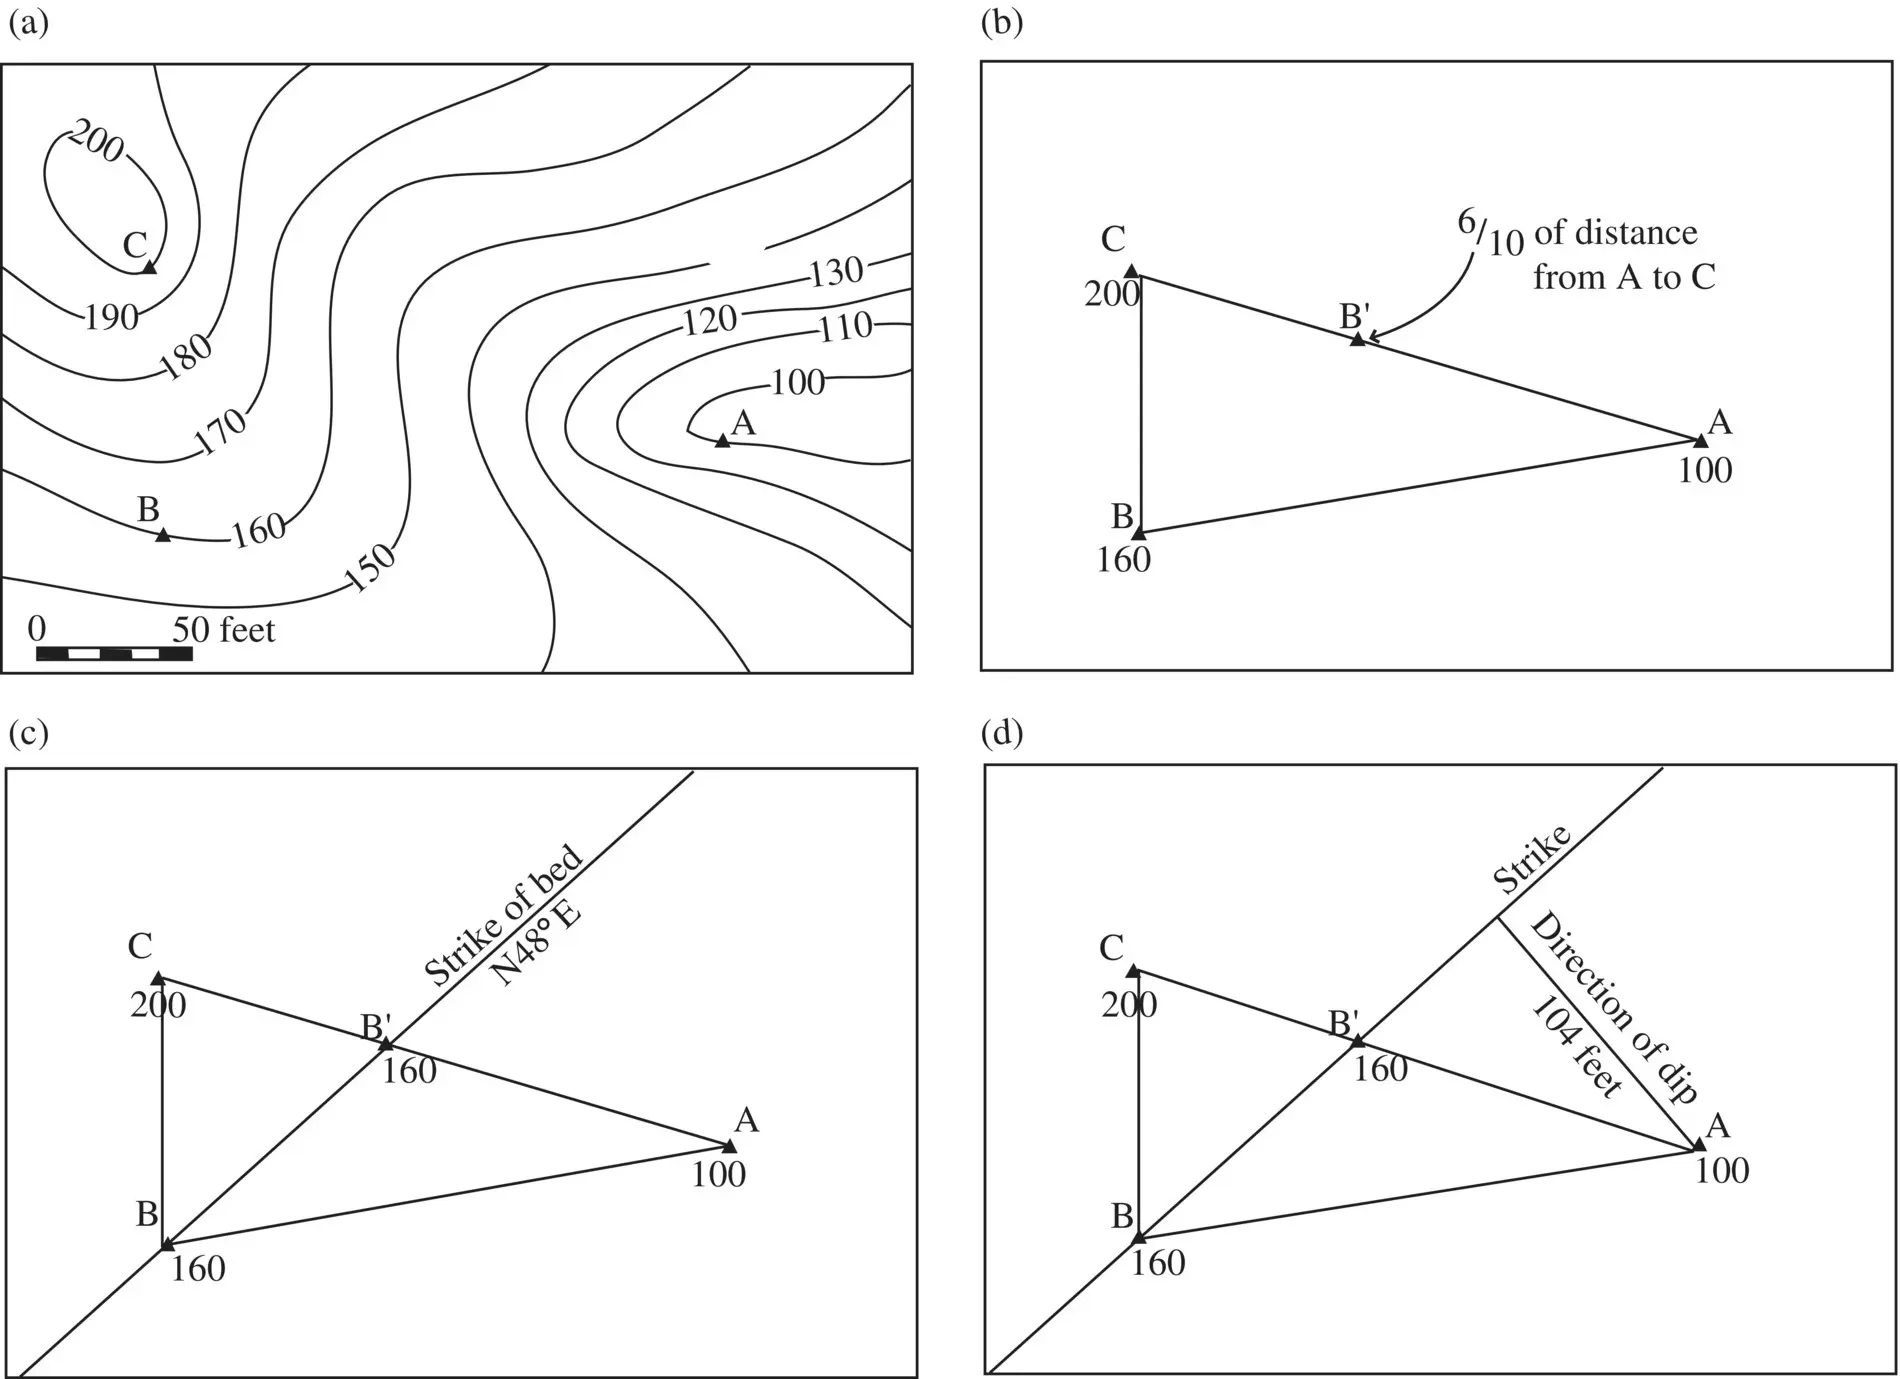
Figure 2.10 Solution of a three‐point problem using a combination of graphical and trigonometric techniques. (a) Three coplanar points (A, B, and C) on a topographic map. (b) Connect by lines to make a triangle. Locate of a fourth point, B′ on the AC line, at the same elevation as point B. (c) Line B–B′ defines the strike of the plane. (d) Dip‐direction line perpendicular to the line B–B′; dip angle determined using Step 6.
Problem 2.2
Points A, B, and C in Figure P2.3are oil wells drilled on a level plain, and all of the wells tap the same oil‐bearing sandstone. The depth ( not the elevation! ) of the top of this sandstone in each well is as follows: A = 5115 ft, B = 6135 ft, and C = 5485 ft.
1 Determine the attitude of the sandstone.
2 If a well is drilled at point D, at what depth would it hit the top of the sandstone?
Drawing a Topographic Profile
Topographic profiles are the first step in drawing a geologic cross section. The profiles show the relief at the earth's surface along the top of the geologic structure section. Usually you will have to construct your own topographic profile. Cross sections must be drawn on topographic profiles with no vertical exaggeration. The technique for drawing a topographic profile is as follows:
1 Draw the section line on the map ( Figure 2.11a).
2 Lay the edge of a piece of paper along the section line, and mark and label on the paper each contour, stream, and ridge crest ( Figure 2.11b).
3 Scale off and label the appropriate elevations on a piece of graph paper ( Figure 2.11c). Graph paper with 10 or 20 squares per inch is ideal for 7.5‐minute quadrangle maps because the scale is 1 in = 2000 ft. Notice that the map scales on Figures 2.11a and 2.11b are the same as the vertical scale on Figures 2.11c and 2.11d. It is very important that the vertical and horizontal scales are the same on structure sections. This is a very common oversight. If the scale of the structure section is not the same as the scale of the map then the dips cannot be drawn at their normal angle. Figure 2.11 Technique for drawing a topographic profile. (a) Draw section line on map. (b) Transfer contour crossings, streams, and other features to another sheet of paper. (c) Transfer points to proper elevation on cross section sheet. (d) Connect points in a way that reflects the topographic subtleties recorded on the map.
4 Lay the labeled paper on the graph paper and transfer each contour, stream, and ridge crest point to the proper elevation on the graph paper ( Figure 2.11c).
5 Connect the points ( Figure 2.11d).
Drawing Cross Sections of Structure Contour Maps
A geologic cross section can now be added to the topographic profile. The procedure is essentially the same as the topographic profile except structure contours are used instead of topographic contours. This is a very simple procedure for planar features because they will appear as straight lines and, unlike complex topography, only two points are needed to define a straight line.
1 Construct a topographic profile ( Figure 2.12).
2 Lay the edge of a piece of paper along the section line, and mark and label on the paper at least two structural contour elevations for each contact.
3 Lay the labeled paper on the graph paper and transfer each structure contour point chosen to the proper elevation on the graph paper/profile ( Figure 2.12).
Читать дальшеИнтервал:
Закладка:
Похожие книги на «Structural Analysis and Synthesis»
Представляем Вашему вниманию похожие книги на «Structural Analysis and Synthesis» списком для выбора. Мы отобрали схожую по названию и смыслу литературу в надежде предоставить читателям больше вариантов отыскать новые, интересные, ещё непрочитанные произведения.


Обсуждение, отзывы о книге «Structural Analysis and Synthesis» и просто собственные мнения читателей. Оставьте ваши комментарии, напишите, что Вы думаете о произведении, его смысле или главных героях. Укажите что конкретно понравилось, а что нет, и почему Вы так считаете.