Water, Climate Change, and Sustainability
Здесь есть возможность читать онлайн «Water, Climate Change, and Sustainability» — ознакомительный отрывок электронной книги совершенно бесплатно, а после прочтения отрывка купить полную версию. В некоторых случаях можно слушать аудио, скачать через торрент в формате fb2 и присутствует краткое содержание. Жанр: unrecognised, на английском языке. Описание произведения, (предисловие) а так же отзывы посетителей доступны на портале библиотеки ЛибКат.
- Название:Water, Climate Change, and Sustainability
- Автор:
- Жанр:
- Год:неизвестен
- ISBN:нет данных
- Рейтинг книги:4 / 5. Голосов: 1
-
Избранное:Добавить в избранное
- Отзывы:
-
Ваша оценка:
Water, Climate Change, and Sustainability: краткое содержание, описание и аннотация
Предлагаем к чтению аннотацию, описание, краткое содержание или предисловие (зависит от того, что написал сам автор книги «Water, Climate Change, and Sustainability»). Если вы не нашли необходимую информацию о книге — напишите в комментариях, мы постараемся отыскать её.
is a timely and in-depth examination of the concept of sustainability
as it relates to water resources management in the context of climate change risks.
Featuring contributions by global authors, this edited volume is organized into three sections: Sustainability Concepts; Sustainability Approaches, Tools, and Techniques; and Sustainability in Practice. Detailed chapters describe the linkage between water and sustainable development, highlight the development and use of new measuring and reporting methods, and discuss the implementation of sustainability concepts in various water use sectors. Topics include localizing and mainstreaming global water sustainability initiatives, resilient water infrastructure for poverty reduction, urban water security for sustainable cities, climate actions and challenges for sustainable ecosystem services, and more. This important resource:
Reviews contemporary scientific research and practical applications in the areas of water, climate change and sustainability in different regions of the world Discusses future directions of research and practices in relation to expected patterns of climate changes Covers a wide range of concepts, theories, and perspectives of sustainable development of water resources Features case studies of field and modelling techniques for analyzing water resources and evaluating vulnerability, security, and associated risks Discusses practical applications of water resources in contexts such as food security, global health, clean energy, and climate action
is an invaluable resource for policy makers water managers, researchers, and other professionals in the field, and an ideal text for graduate students in hydrogeology, climate change, geophysics, geochemistry, geography, water resources, and environmental science.
Water, Climate Change, and Sustainability — читать онлайн ознакомительный отрывок
Ниже представлен текст книги, разбитый по страницам. Система сохранения места последней прочитанной страницы, позволяет с удобством читать онлайн бесплатно книгу «Water, Climate Change, and Sustainability», без необходимости каждый раз заново искать на чём Вы остановились. Поставьте закладку, и сможете в любой момент перейти на страницу, на которой закончили чтение.
Интервал:
Закладка:
From accumulated knowledge and information so far, it is convincing that water resources are under pressure from competing uses and climate change and governance is a key challenge in achieving the long‐term sustainability of this valuable natural resources (Özerol et al. 2018). Climate change, which manifests through water, exacerbates the pressure on water thereby further complicating resource governance (IPCC 2014). Water, in direct or implied way, has been increasing evident as a core in global commitments such as MDGs, SDGs, climate agreements, and international trades. Water challenges become the center of discussion in most international forums/platforms. Some of the global water challenges of this time, which are expected to continue in future, are growing water demand and water scarcity; water pollution; insufficient access to safe and affordable water, sanitation and hygiene (WASH); increasing risk to freshwater ecosystems; climate change impacts on water; water governance; and water cooperation and conflicts in the shared aquifers and river basins. Water solutions in the form of understanding water availability, enhancing access with reliability, reducing losses, improving WASH, and managing the water resources are advancing over the years along with advancement in science and technology. The solutions, however, are context‐specific and there are no silver bullet solutions. As water is the multi‐facet issue, stakeholders from multiple disciplines need to work together to harness benefit from the water in the most optimal way but at the same time without compromising sustainability of resources.
1.2.2 Evolution of Climate Change as a Global Agenda
Various literatures report on emergence and spread of climate change as the global problem albeit with different orientation (e.g. BBC News 2020; History.com Editors 2020; Wear, 2008). This section presents a highly synthesized summary of climate change in the sustainability context. Early ideas that human can alter global climate can be traced back to the ancient Greeks, where people believed that humans could change temperatures and influence rainfall by chopping down trees, plowing fields or irrigating a desert. However, the theory of the greenhouse effect and the potential of industrial activities to intensify the effect were first identified by Fourier, Tyndale, and Arrhenius in 1827, 1859, and 1896, respectively. Tyndall’s laboratory tests in the late 1860s confirmed that coal gas (containing CO 2, methane and volatile hydrocarbons) is effective at absorbing solar radiation. By the 1890s, the concept of warming the planet was welcomed considering that it may benefit colder regions of the earth. By the 1930s, scientists started to argue on the potential consequences of “global warming”, which continued until the 1960s (Weart 2008). The most famous among those research projects was establishing a CO 2monitoring station in 1958 at Hawaii’s Mauna Loa Observatory. The plot based on data from the observatory, popularly known as “Keeling Curve”, revealed a steady rise in CO 2levels. The observation at the station, which constitutes the master time series documenting the changing composition of the atmosphere (Keeling 1998), has an iconic status in climate science as evidence of anthropogenic effect on the atmosphere’s chemical composition. Later observations of parallel trends in the atmospheric abundance of the CO 2isotope and molecular oxygen (O 2) uniquely identified this rise in CO 2with fossil fuel burning (Le Treut et al., 2007). Though the idea of the greenhouse effect and global warming was emerged in the 1800s, it took nearly a century of research and data, until the late 1950s, to convince the vast majority of the scientific community that human activity could alter our planet’s climate. Table 1.3depicts a chronology of evolution of international climate negotiations over the years in light of increasing concentration of atmospheric CO 2.
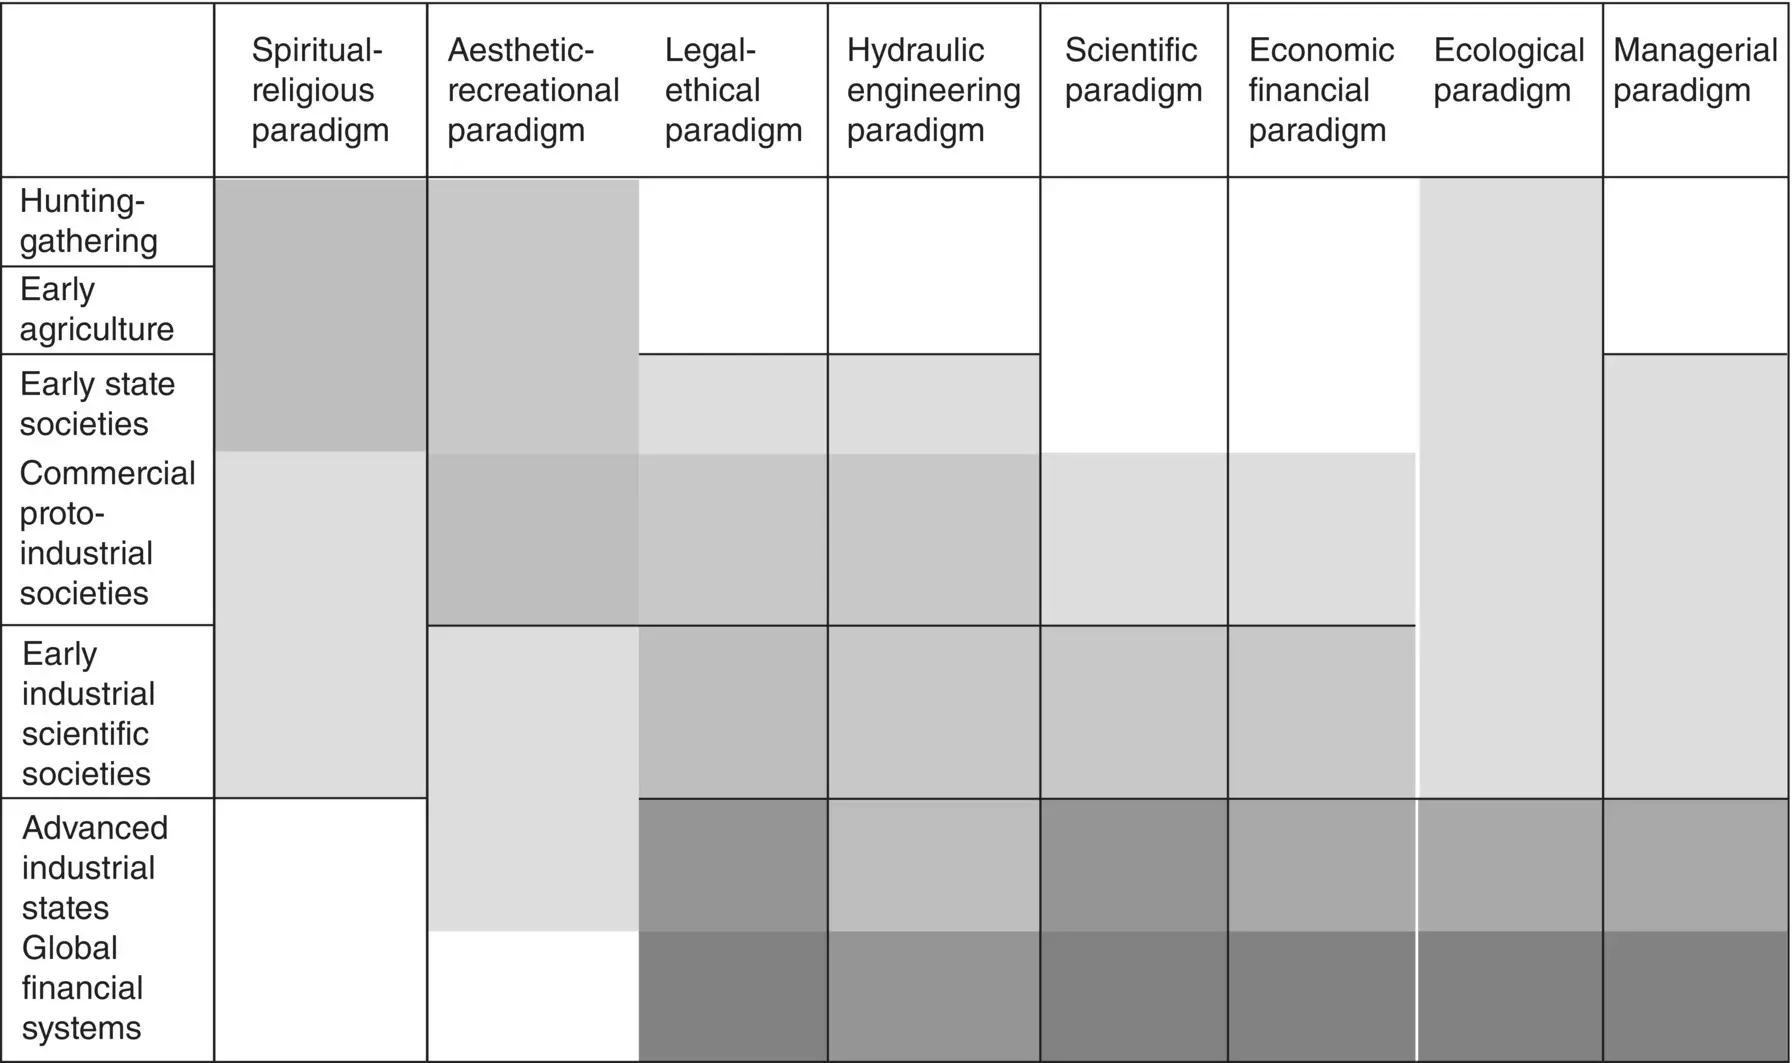
Figure 1.1 A diagrammatic illustration of the historical development of water management paradigms. Shading intensity indicates the degree of dominance of a paradigm relative to others.
( Source: Hassan F. (2011). Water history of our times: IHP Essay on water history (Volume 2). Paris, France: UNESCO Publishing. © 2011, UNESCO).
The dawn of advance computer modeling in the 1960s began to predict possible outcomes of the rise in CO 2levels. The models consistently showed that doubling of CO 2could produce a warming of 2°C or higher within the next century (Voosen 2019). Though a different kind of climate worry took hold in the early 1970s, somewhat cooling of earth between 1940 – 1970 due to the post‐war boom of aerosol pollutants which reflected sunlight away from the planet, WMO started to express concern on human‐induced CO 2emission, global warming, and potential consequences around the same time (i.e. early 1970s). During the 1980s scientific concerns about global warming grew, global temperature increased sharply, and it started to get political attention. As a result, the WMO and UNEP established IPCC under the UN in 1988 to investigate and report on scientific evidence on climate change, potential economic and political impacts, and suggest possible international responses to climate change. Since then, IPCC has been central to the subsequent debates and processes around the development of climate change policies. Since the 1990s, scientific research on climate change has included multiple disciplines and has expanded further. Research since the 1990s are summarized in the form of Assessment Reports published in regular interval by IPCC. After the first assessment report (FAR) published in 1990, IPCC has already released five such assessment reports and the sixth assessment report (AR6) is underway. The IPCC FAR in 1990 fed into the drafting of the UNFCCC in 1991, which was later signed by 166 nations at the Earth Summit in Rio de Janerio in 1992 and came into force in 1994.
Table 1.3 Selected international negotiations on climate change in light of increasing atmospheric CO 2concentration.
Source: Updated from Shivakoti BR, and Shrestha S (2014).
| Year | CO 2(ppm) * | Major development and outcomes |
|---|---|---|
| 2015 | 400.83 | Paris Climate Agreement (PCA) |
| 2013 | 396.66 | On May 10, 2013, NOAA and Scripps Institute of Oceanography (SIO) for the first time detected daily CO 2average concertation temporarily reaching 400 ppm First volume of IPCC Fifth Assessment Report (AR5) released |
| 2012 | 393.87 | COP18 sets out a timeline to adopt a universal climate agreement by 2015, to come into effect in 2020 |
| 2011 | 391.74 | The Durban Platform for Enhanced Action at COP17: governments clearly recognized the need to draw up the blueprint for a fresh universal, legal agreements to deal with climate change beyond 2020 |
| 2010 | 389.84 | Cancun Agreements, drafted and largely accepted by the COP (COP16) – comprehensive measures for mitigation, adaptation, financing, technology transfer and capacity building |
| 2009 | 387.35 | Attended by close to 115 world leaders at the high‐level segment, Copenhagen Accord drafted at COP15 recognizes scientific view on limiting warming below 2°C; countries later submitted emission reduction pledges or mitigation action pledges, all non‐binding developed countries agreed to support a goal of mobilizing US$100 billion a year by 2020 to address the needs of developing countries |
| 2007 | 383.93 | IPCC fourth assessment report (AR4) released; IPCC awarded 2007 Nobel Peace Prize at the end of the year. At COP13, Parties agreed on the Bail Road Map, which charted the way towards a post‐Kyoto Protocol (KP) outcome. |
| 2006 | 381.88 | Stern Review on the Economics of climate change published – emphasis on early action in mitigation and adaptation; benefits of action outweigh cost of inaction |
| 2005 | 379.95 | Entry into force of the KP |
| 2001 | 371.30 | IPCC Third Assessment Report (AR3) released, Marrakesh Accords adopted at COP7 detailing rules for implementation of the KP |
| 1997 | 363.73 | KP adopted at Conference of Parties 3 (COP3) meeting held in Kyoto – a binding agreement among nations to curb GHG emission through a number of market and non‐market‐based mechanisms |
| 1995 | 360.80 | IPCC Second Assessment Report (SER) released; The first Conference of the Parties (COP1) in Berlin held |
| 1994 | 358.69 | UNFCCC enters into force |
| 1992 | 356.73 | UNFCCC treaty agreed at Rio Earth Summit |
| 1990 | 354.39 | IPCC’s First Assessment Report (FAR) released. IPCC and 2 ndWorld Climate Conference (WCC) call for a global climate change treaty |
| 1988 | 351.51 | IPCC established |
| 1979 | 336.91 | The first WCC held; World Climate Research Program launched |
| 1967 | 323.04 | International Global Atmospheric Research Program established |
| 1958 | 315.71 # | High accuracy measurements of atmospheric CO 2concentration initiated by Charles David Keeling at Mauna Loa Observatory in Hawaii |
| 1800‐1870 | 290 (around) # | Beginning of Industrial Revolution |
* Average annual atmospheric CO 2 concentration (ppm) observed at Mauna Loa Observatory, Accessed on 24 th April, 2020 from: https://www.esrl.noaa.gov/gmd/dv/data/index.php?parameter_name=Carbon%2BDioxide&site=MLO
Читать дальшеИнтервал:
Закладка:
Похожие книги на «Water, Climate Change, and Sustainability»
Представляем Вашему вниманию похожие книги на «Water, Climate Change, and Sustainability» списком для выбора. Мы отобрали схожую по названию и смыслу литературу в надежде предоставить читателям больше вариантов отыскать новые, интересные, ещё непрочитанные произведения.


Обсуждение, отзывы о книге «Water, Climate Change, and Sustainability» и просто собственные мнения читателей. Оставьте ваши комментарии, напишите, что Вы думаете о произведении, его смысле или главных героях. Укажите что конкретно понравилось, а что нет, и почему Вы так считаете.