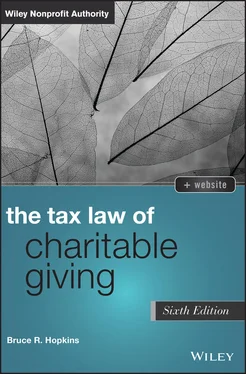
Bruce R. Hopkins - The Tax Law of Charitable Giving
Здесь есть возможность читать онлайн «Bruce R. Hopkins - The Tax Law of Charitable Giving» — ознакомительный отрывок электронной книги совершенно бесплатно, а после прочтения отрывка купить полную версию. В некоторых случаях можно слушать аудио, скачать через торрент в формате fb2 и присутствует краткое содержание. Жанр: unrecognised, на английском языке. Описание произведения, (предисловие) а так же отзывы посетителей доступны на портале библиотеки ЛибКат.
- Название:The Tax Law of Charitable Giving
- Автор:
- Жанр:
- Год:неизвестен
- ISBN:нет данных
- Рейтинг книги:5 / 5. Голосов: 1
-
Избранное:Добавить в избранное
- Отзывы:
-
Ваша оценка:
- 100
- 1
- 2
- 3
- 4
- 5
The Tax Law of Charitable Giving: краткое содержание, описание и аннотация
Предлагаем к чтению аннотацию, описание, краткое содержание или предисловие (зависит от того, что написал сам автор книги «The Tax Law of Charitable Giving»). Если вы не нашли необходимую информацию о книге — напишите в комментариях, мы постараемся отыскать её.
The Tax Law of Charitable Giving — читать онлайн ознакомительный отрывок
Ниже представлен текст книги, разбитый по страницам. Система сохранения места последней прочитанной страницы, позволяет с удобством читать онлайн бесплатно книгу «The Tax Law of Charitable Giving», без необходимости каждый раз заново искать на чём Вы остановились. Поставьте закладку, и сможете в любой момент перейти на страницу, на которой закончили чтение.
Интервал:
Закладка:
§ 1.4 STATISTICAL PROFILE OF CHARITABLE SECTOR
The charitable sector and the federal tax law with respect to it have a common feature: enormous and incessant growth. This expansion is reflected in all of the principal indicators pertaining to this sector, including the number of organizations, the sector's asset base, the amount of charitable giving and granting, its annual expenditures, its share of the gross domestic product, and the size of its workforce. There is, however, this direct correlation: as the nonprofit sector expands, so too does the body of federal and state law regulating it. No end to either of these expansions is in sight. 90
Over the years, there have been many efforts to analyze and portray the nonprofit sector. One of the first of these significant undertakings, utilizing statistics, conducted jointly by the Survey Research Center at the University of Michigan and the U.S. Census Bureau, was published in 1975 as part of the findings of the Commission on Private Philanthropy and Public Needs. 91 The data compiled for the commission's use were for 1973. Contemporary charitable giving statistics are explored in the following pages, but one striking basis of comparison cannot be resisted at this point. Charitable giving in that year was $26 billion, while for 2019 the amount was nearly $450 billion. 92
Research of this nature developed for the commission spawned recurring statistical portraits of the sector. One of the most comprehensive of these analyses is that provided in the periodic almanac published by the Urban Institute. 93 Others include a fascinating portrait of the “third America” 94 and the annual survey of charitable giving published by the Giving USA Foundation. 95 The IRS's Statistics of Income Division collects data on tax-exempt organizations. 96 Further, various subsets of the nonprofit sector are the subject of specific portrayals. 97
The nonprofit sector in the United States is not uniformly labeled; it goes by many names. In addition to nonprofit , adjectives used include tax-exempt , voluntary , nongovernmental , independent , and voluntary . 98 (In the author's view, nonprofit sector endures as the sturdiest of the terms.) In its most expansive definition, the nonprofit sector comprises all tax-exempt organizations and some entities that cannot qualify for exemption. The Independent Sector organization defined the independent sector as all chari table 99and social welfare organizations. 100
As Independent Sector defined the sector, it is comprised of “many, varied” organizations, such as “religious organizations, private colleges and schools, foundations, hospitals, day care centers, environmental organizations, museums, symphony orchestras, youth organizations, advocacy groups, and neighborhood organizations, to name a few.” This analysis continued: “What is common among them all is their mission to serve a public purpose, their voluntary and self-governing nature, and their exclusion from being able to distribute profits to stockholders.” 101
Any assessment of any consequence of the nonprofit sector includes a discussion of the number of organizations in the sector. Nonetheless, it is “surprisingly difficult to answer the seemingly simple question, How many nonprofit organizations are there in the United States?” 102 The simple answer is: millions. There are “several million” nonprofit organizations, although “no one really knows how many.” 103
Most nonprofit organizations are tax-exempt entities, however, and the number of those entities is in excess of two million. The IRS's data for the federal government's fiscal year 2019 reflect 1,718,233 recognized conventional exempt organizations. 104 Of these, 1,365,744 are charitable, educational, religious, scientific, and similar entities. Other categories of exempt organizations include social welfare organizations (79,808), 105 trade associations and other types of business leagues (62,700), 106 social and recreational clubs (49,126), 107 labor and agricultural organizations (45,888), 108 fraternal beneficiary societies (41,756), 109 veterans' organizations (28,575), 110 and cemetery companies (9,406). 111 Exempt organizations filed 1,118,006 annual information returns and similar forms in that year. 112
In an understatement, the observation was made that “[m]easuring the number of organizations in the independent sector is a complex activity, largely because of the diversity of its components.” 113 There are several reasons for this. One reason is that church organizations (of which there are an estimated 350,000 114 ) are not required to file annual information returns with the IRS, 115 so data concerning them is difficult to amass. Also, hundreds of organizations fall under a group exemption 116 and thus are not separately identified. Further, smaller nonprofit organizations need not seek recognition of tax exemption from the IRS. 117 Small organizations are not required to file annual information returns with the IRS but are required to electronically file a short notice as to their existence. 118
Because a “price cannot be placed on the output of most nonprofit organizations,” their percentage of the gross domestic product is difficult to assess; the best estimate is that it is about 5 percent. 119 When the measure is in terms of wages and salaries paid, the percentage rises to approximately 8 percent. 120 Other ways to measure the size of the sector are its revenue (about $1,006.7 billion in 2006), 121 its outlays (about $915.2 billion in 2005), 122 and its paid employment (12.9 million individuals in 2005). 123 Most of the sector's revenue is in the form of fees for services provided, followed by contributions and grants. 124 As to outlays (2006 data), the funds are expended by the organizations (88.7 percent), granted (8 percent), or invested or used as a buffer for cash flow (3.3 percent). 125
Charitable giving in the United States in 2019 is estimated to have totaled $449.64 billion. 126 Giving by individuals in 2019 amounted to an estimated $309.66 billion; this level of giving constituted 69 percent of all charitable giving for the year. Grantmaking by private foundations is an estimated $75.69 billion (17 percent of total funding). Gifts in the form of charitable bequests in 2019 are estimated to be $43.21 billion (10 percent of total giving). Gifts from corporations in 2019 totaled $21.09 billion (5 percent of total giving for that year).
Contributions to religious organizations in 2019 totaled $128.17 billion (29 percent of all giving that year). Gifts to educational organizations amounted to $64.11 billion (14 percent); to human service entities, $55.99 billion (12 percent); to foundations, $53.51 billion (12 percent); to health care institutions, $41.46 billion (9 percent); to public/society benefit organizations, $37.16 billion (8 percent); to international affairs entities, $28.99 billion (6 percent); to arts, culture, and humanities entities, $21.64 billion (5 percent); and to environment and animals groups, $14.16 billion (3 percent).
According to the most recent IRS data, total noncash charitable contributions increased by 15 percent from $64 billion in 2015 to $73.6 billion in 2016. 127 The average noncash contribution amount per tax return increased from $7,607 to $8,509 during this period. The number of individual returns filed with a Form 8283 128 increased by 2.8 percent from 8.4 million for 2015 to 8.7 million for 2016.
Contributions of corporate stock represented the largest share of total noncash gifts, in terms of value claimed. For 2016, corporate stock donations totaled $32.7 billion, an increase of 13.2 percent from 2015, representing 44.4 percent of all these donations. The average stock contribution per return in 2016 was $199,939. Gifts of clothing ($11.5 billion) constituted the second-largest category; the average such gift per return was $1,765.
Читать дальшеИнтервал:
Закладка:
Похожие книги на «The Tax Law of Charitable Giving»
Представляем Вашему вниманию похожие книги на «The Tax Law of Charitable Giving» списком для выбора. Мы отобрали схожую по названию и смыслу литературу в надежде предоставить читателям больше вариантов отыскать новые, интересные, ещё непрочитанные произведения.
Обсуждение, отзывы о книге «The Tax Law of Charitable Giving» и просто собственные мнения читателей. Оставьте ваши комментарии, напишите, что Вы думаете о произведении, его смысле или главных героях. Укажите что конкретно понравилось, а что нет, и почему Вы так считаете.


