Jakob J. Zyl - Introduction to the Physics and Techniques of Remote Sensing
Здесь есть возможность читать онлайн «Jakob J. Zyl - Introduction to the Physics and Techniques of Remote Sensing» — ознакомительный отрывок электронной книги совершенно бесплатно, а после прочтения отрывка купить полную версию. В некоторых случаях можно слушать аудио, скачать через торрент в формате fb2 и присутствует краткое содержание. Жанр: unrecognised, на английском языке. Описание произведения, (предисловие) а так же отзывы посетителей доступны на портале библиотеки ЛибКат.
- Название:Introduction to the Physics and Techniques of Remote Sensing
- Автор:
- Жанр:
- Год:неизвестен
- ISBN:нет данных
- Рейтинг книги:3 / 5. Голосов: 1
-
Избранное:Добавить в избранное
- Отзывы:
-
Ваша оценка:
Introduction to the Physics and Techniques of Remote Sensing: краткое содержание, описание и аннотация
Предлагаем к чтению аннотацию, описание, краткое содержание или предисловие (зависит от того, что написал сам автор книги «Introduction to the Physics and Techniques of Remote Sensing»). Если вы не нашли необходимую информацию о книге — напишите в комментариях, мы постараемся отыскать её.
delivers a comprehensive update to the authoritative textbook, offering readers new sections on radar interferometry, radar stereo, and planetary radar. It explores new techniques in imaging spectroscopy and large optics used in Earth orbiting, planetary, and astrophysics missions. It also describes remote sensing instruments on, as well as data acquired with, the most recent Earth and space missions.
Readers will benefit from the brand new and up-to-date concept examples and full-color photography, 50% of which is new to the series. You’ll learn about the basic physics of wave/matter interactions, techniques of remote sensing across the electromagnetic spectrum (from ultraviolet to microwave), and the concepts behind the remote sensing techniques used today and those planned for the future.
The book also discusses the applications of remote sensing for a wide variety of earth and planetary atmosphere and surface sciences, like geology, oceanography, resource observation, atmospheric sciences, and ionospheric studies. This new edition also incorporates:
A fulsome introduction to the nature and properties of electromagnetic waves An exploration of sensing solid surfaces in the visible and near infrared spectrums, as well as thermal infrared, microwave, and radio frequencies A treatment of ocean surface sensing, including ocean surface imaging and the mapping of ocean topography A discussion of the basic principles of atmospheric sensing and radiative transfer, including the radiative transfer equation Perfect for senior undergraduate and graduate students in the field of remote sensing instrument development, data analysis, and data utilization,
will also earn a place in the libraries of students, faculty, researchers, engineers, and practitioners in fields like aerospace, electrical engineering, and astronomy.
Introduction to the Physics and Techniques of Remote Sensing — читать онлайн ознакомительный отрывок
Ниже представлен текст книги, разбитый по страницам. Система сохранения места последней прочитанной страницы, позволяет с удобством читать онлайн бесплатно книгу «Introduction to the Physics and Techniques of Remote Sensing», без необходимости каждый раз заново искать на чём Вы остановились. Поставьте закладку, и сможете в любой момент перейти на страницу, на которой закончили чтение.
Интервал:
Закладка:
The advent of satellites is allowing the acquisition of global and synoptic detailed information about the planets (including the Earth) and their environments. Sensors on Earth‐orbiting satellites provide information about global patterns and dynamics of clouds, surface vegetation cover and its seasonal variations, surface morphologic structures, ocean surface temperature, and near‐surface wind. The rapid wide coverage capability of satellite platforms allows monitoring of rapidly changing phenomena, particularly in the atmosphere. The long duration and repetitive capability allows the observation of seasonal, annual, and longer term changes such as polar ice cover, desert expansion, solid surface motion, and subsidence and tropical deforestation. The wide‐scale synoptic coverage allows the observation and study of regional and continental scale features such as plate boundaries and mountain chains.
Sensors on planetary probes (orbiters, flybys, surface stations, and rovers) are providing similar information about the planets and objects in the solar system. By now all the planets in the solar system have been visited by one or more spacecraft. The comparative study of the properties of the planets is providing new insight into the formation and evolution of the solar system.
1.1 Types and Classes of Remote Sensing Data
The type of remote sensing data acquired is dependent on the type of information being sought, as well as on the size and dynamics of the object or phenomena being studied. The different types of remote sensing data and their characteristics are summarized in Table 1.1. The corresponding sensors and their role in acquiring different types of information are illustrated in Figure 1.1.
Two‐dimensional images are usually required when high‐resolution spatial information is needed, such as in the case of surface cover and structural mapping ( Figs. 1.2and 1.3), or when a global synoptic view is instantaneously required, such as in the case of meteorological and weather observations ( Fig. 1.4). Two‐dimensional images can be acquired over wide regions of the electromagnetic spectrum ( Fig. 1.5) and with a wide selection of spectral bandwidths. Imaging sensors are available in the microwave, infrared (IR), visible, and ultraviolet parts of the spectrum using electronic and photographic detectors. Images are acquired by using active illumination, such as radars or lasers; solar illumination, such as in the ultraviolet, visible, and near infrared; or emission from the surface, such as in thermal infrared, microwave emission ( Fig. 1.6), and x‐ and gamma‐rays.
Table 1.1 Types of remote sensing data.
| Important type of information needed | Type of sensor | Examples of sensors |
|---|---|---|
| High spatial resolution and wide coverage | Imaging sensors, cameras | Large‐format camera (1984), Seasat imaging radar (1978), Magellan radar mapper (1989), Mars Global Surveyor Camera (1996), Mars Rover Camera (2004 and 2014), Cassini Camera (2006) |
| High spectral resolution over limited areas or along track lines | Spectrometers, spectroradiometers | Shuttle multispectral imaging radiometer (1981), Hyperion (2000) |
| Limited spectral resolution with high spatial resolution | Multispectral mappers | Landsat multispectral mapper and thematic mapper (1972–1999), SPOT (1986–2002), Galileo NIMS (1989) |
| High spectral and spatial resolution | Imaging spectrometer | Spaceborne imaging spectrometer (1991), ASTER (1999), Hyperion (2000) |
| High accuracy intensity measurement along line tracks or wide swath | Radiometers, scatterometers | Seasat (1978), ERS‐1/2 (1991, 1997), NSCAT (1996), QuikSCAT (1999), SeaWinds (2002) scatterometers |
| High accuracy intensity measurement with moderate imaging resolution and wide coverage | Imaging radiometers | Electronically scanned microwave radiometer (1975), SMOS (2007) |
| High accuracy measurement of location and profile | Altimeters, sounders | Seasat (1978), GEOSAT (1985), TOPEX/Poseidon (1992), and Jason (2001) altimeter, Pioneer Venus orbiter radar (1979), Mars orbiter altimeter (1990) |
| Three‐dimensional topographic mapping | Scanning altimeters and interferometers | Shuttle Radar Topography Mission (2000) |
| Surface displacement mapping | Radar interferometer | Sentinel (2012, 2016), SkyMed (2007), ALOS (2006), TANDEMX (2010), ALOS‐2 (2014) |
Spectrometers are used to detect, measure, and chart the spectral content of the incident electromagnetic field ( Figs. 1.7and 1.8). This type of information plays a key role in identifying the chemical composition of the object being sensed, be it a planetary surface or atmosphere. In the case of atmospheric studies, the spatial aspect is less critical than the spectral aspect due to the slow spatial variation in the chemical composition. In the case of surface studies, both spatial and spectral information are essential, leading to the need for imaging spectrometers ( Figs. 1.9and 1.10). The selection of the number of spectral bands, the bandwidth of each band, the imaging spatial resolution, and the instantaneous field of view leads to trade‐offs based on the object being sensed, the sensor data‐handling capability, and the detector technological limits.
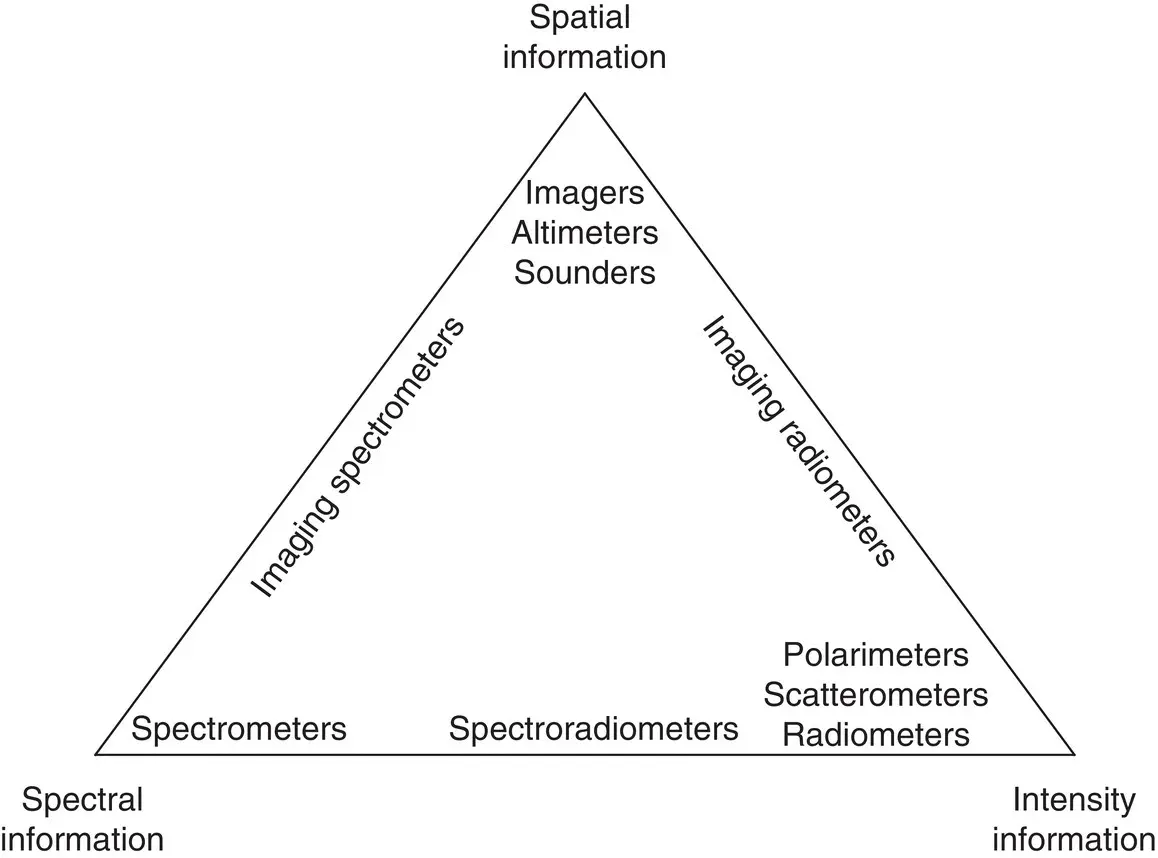
Figure 1.1 Diagram illustrating the different types of information sought after and the type of sensor used to acquire this information. For instance, spectral information is acquired with a spectrometer. Two‐dimensional surface spatial information is acquired with an imager such as a camera. An imaging spectrometer also acquires for each pixel in the image the spectral information.
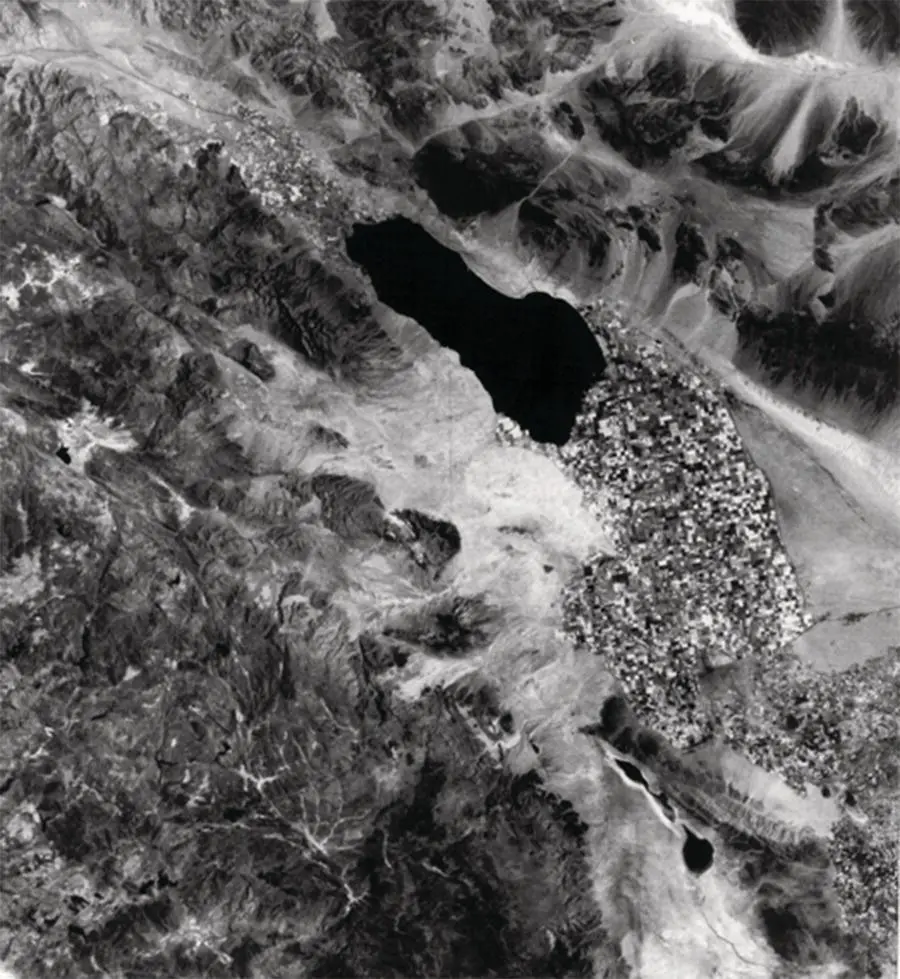
Figure 1.2 Landsat MSS visible/near IR image of the Imperial Valley area in California.
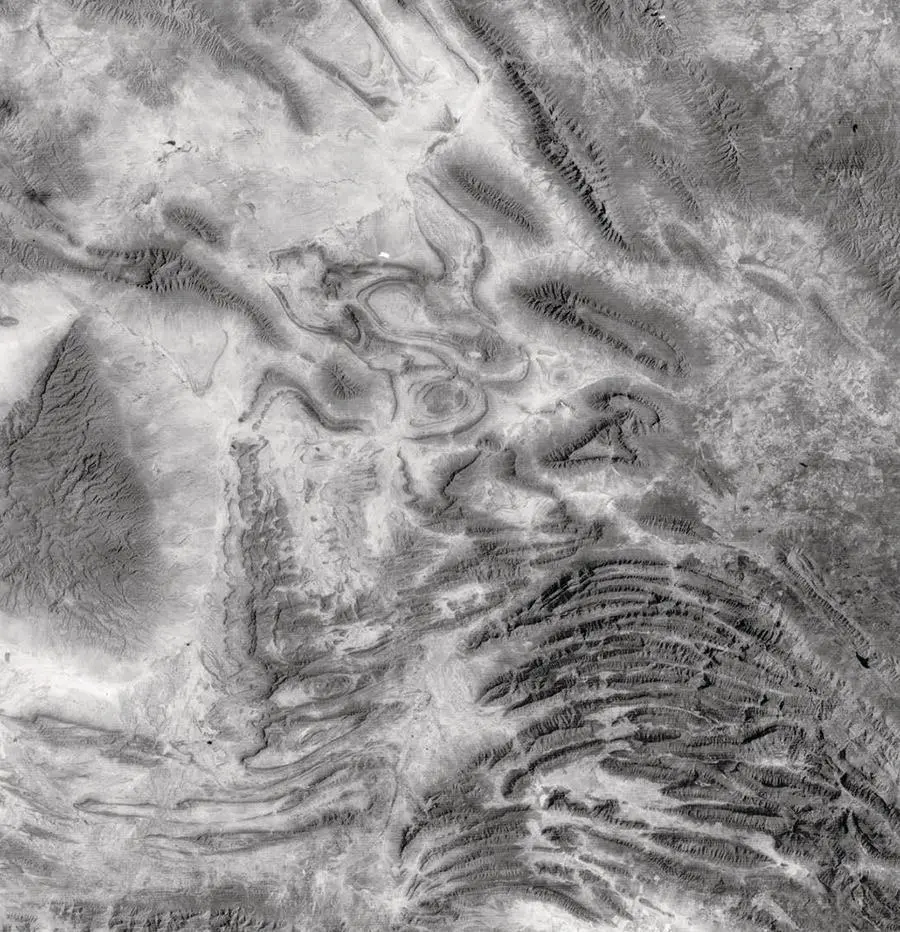
Figure 1.3 Folded mountains in the Sierra Madre region, Mexico (Landsat MSS).
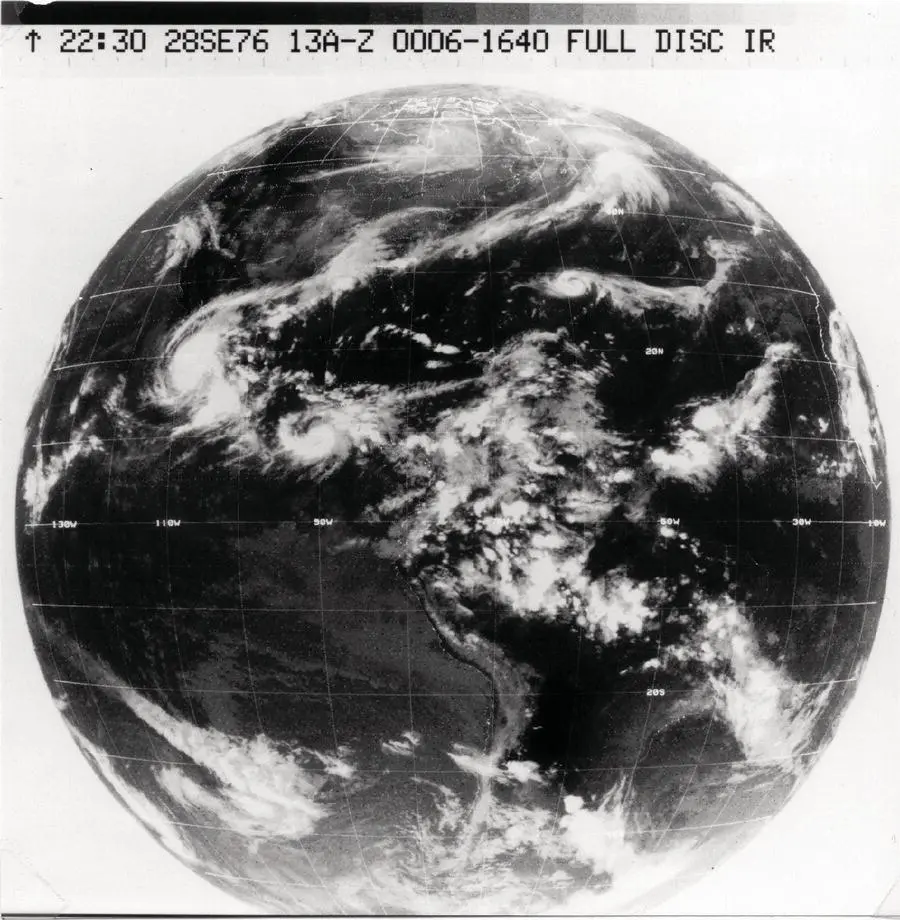
Figure 1.4 Infrared image of the western hemisphere acquired from a meteorological satellite.
In a number of applications, both the spectral and spatial aspects are less important, and the information needed is contained mainly in the accurate measurement of the intensity of the electromagnetic wave over a wide spectral region. The corresponding sensors, called radiometers, are used in measuring atmospheric temperature profiles and ocean surface temperature. Imaging radiometers are used to spatially map the variation of these parameters ( Fig. 1.11). In active microwave remote sensing, scatterometers are used to accurately measure the backscattered field when the surface is illuminated by a signal with a narrow spectral bandwidth ( Fig. 1.12). One special type of radiometer, or scatterometer, is the polarimeter, in which the key information is embedded in the polarization state of the transmitted, reflected, or scattered wave. The polarization characteristic of reflected or scattered sunlight provides information about the physical properties of planetary atmospheres.
Читать дальшеИнтервал:
Закладка:
Похожие книги на «Introduction to the Physics and Techniques of Remote Sensing»
Представляем Вашему вниманию похожие книги на «Introduction to the Physics and Techniques of Remote Sensing» списком для выбора. Мы отобрали схожую по названию и смыслу литературу в надежде предоставить читателям больше вариантов отыскать новые, интересные, ещё непрочитанные произведения.


Обсуждение, отзывы о книге «Introduction to the Physics and Techniques of Remote Sensing» и просто собственные мнения читателей. Оставьте ваши комментарии, напишите, что Вы думаете о произведении, его смысле или главных героях. Укажите что конкретно понравилось, а что нет, и почему Вы так считаете.