Thomas N. Bulkowski - Encyclopedia of Chart Patterns
Здесь есть возможность читать онлайн «Thomas N. Bulkowski - Encyclopedia of Chart Patterns» — ознакомительный отрывок электронной книги совершенно бесплатно, а после прочтения отрывка купить полную версию. В некоторых случаях можно слушать аудио, скачать через торрент в формате fb2 и присутствует краткое содержание. Жанр: unrecognised, на английском языке. Описание произведения, (предисловие) а так же отзывы посетителей доступны на портале библиотеки ЛибКат.

- Название:Encyclopedia of Chart Patterns
- Автор:
- Жанр:
- Год:неизвестен
- ISBN:нет данных
- Рейтинг книги:3 / 5. Голосов: 1
-
Избранное:Добавить в избранное
- Отзывы:
-
Ваша оценка:
Encyclopedia of Chart Patterns: краткое содержание, описание и аннотация
Предлагаем к чтению аннотацию, описание, краткое содержание или предисловие (зависит от того, что написал сам автор книги «Encyclopedia of Chart Patterns»). Если вы не нашли необходимую информацию о книге — напишите в комментариях, мы постараемся отыскать её.
, Third Edition expands upon Bulkowski's immensely popular Second Edition with fully revised and updated material on chart patterns. Whether you’re new to the stock market or an experienced professional trader, use this book as a reference guide to give you an edge.
Within the pages of this book, you’ll learn how to identify chart patterns, supported by easy-to-understand performance statistics describing how well a pattern works, what the failure rate is, and what special quirks suggest better future performance. You’ll discover how often a stop loss order will trigger at various locations within a chart pattern, how the chart pattern’s performance has evolved over the past three decades, and how to profit from failure by trading busted patterns.
This broadened and revised
offers investors the most comprehensive, up-to-date guide to this popular method of market analysis. Written by a leading expert on chart patterns, Tom Bulkowski, this edition includes revised statistics on 75 chart patterns including 23 new ones, with pictures and performance statistics, packaged within easy-to-read text.
Gain essential knowledge of chart patterns and how they are used to predict price movements in bull and bear markets New tables include how often stops are hit, busted pattern performance, performance over the decades, and special pattern features Joining Tour, Identification Guidelines, Focus on Failures, Statistics, Trading Tactics and Sample Trade is Experience. It puts you in the passenger’s seat so you can share lessons learned from Bulkowski's trades This edition reports on statistics from nearly four times the number of samples used in the Second Edition and ten times the number in the , Third Edition further solidifies the reputation of this book as the leading reference on chart patterns, setting it far above the competition.
Encyclopedia of Chart Patterns — читать онлайн ознакомительный отрывок
Ниже представлен текст книги, разбитый по страницам. Система сохранения места последней прочитанной страницы, позволяет с удобством читать онлайн бесплатно книгу «Encyclopedia of Chart Patterns», без необходимости каждый раз заново искать на чём Вы остановились. Поставьте закладку, и сможете в любой момент перейти на страницу, на которой закончили чтение.
Интервал:
Закладка:
Price meanders up and down as it searches for a bottom at C. The valley between BD looks like a mutant head‐and‐shoulders bottom (the left shoulder is LS, the right shoulder is RS, with head C between them. It's not an ideal head‐and‐shoulders because the two shoulders don't bottom at the same price).
At peak D, price gaps lower (breakaway gap) as if it can wait to reach grandma's house at E. The stock bottoms at E, which is just above the launch price (A). Notice that in this example, the rise from A to B is similar to the drop from D to E. That behavior rarely happens, so consider this a textbook example.
Appearance.Look for two peaks that top out near the same price. The two peaks likely won't share the exact same price, but they should be close. Use your best judgment and be flexible. If the right peak is higher than the left, performance improves but only by a percentage point. Oddly, performance is best if both peaks share the same price.
Table 6.1 Identification Guidelines
| Characteristic | Discussion |
|---|---|
| Appearance | Two peaks near the same price form a pattern that resembles an M. The price trend approaching the first peak should move upward at a good clip, with few or no pauses along the way. Be flexible, though. |
| Price trend | Price rises into the first top, often a multiple of the big M's height. See text for guidance. |
| Volume | Trends downward from peak to peak. |
| Breakout direction, confirmation | Downward. A breakout occurs when price closes below the valley between the two peaks. It confirms the pattern as a valid big M. |
| Duration | No minimum is set, but the median time between the two peaks is about a month. |
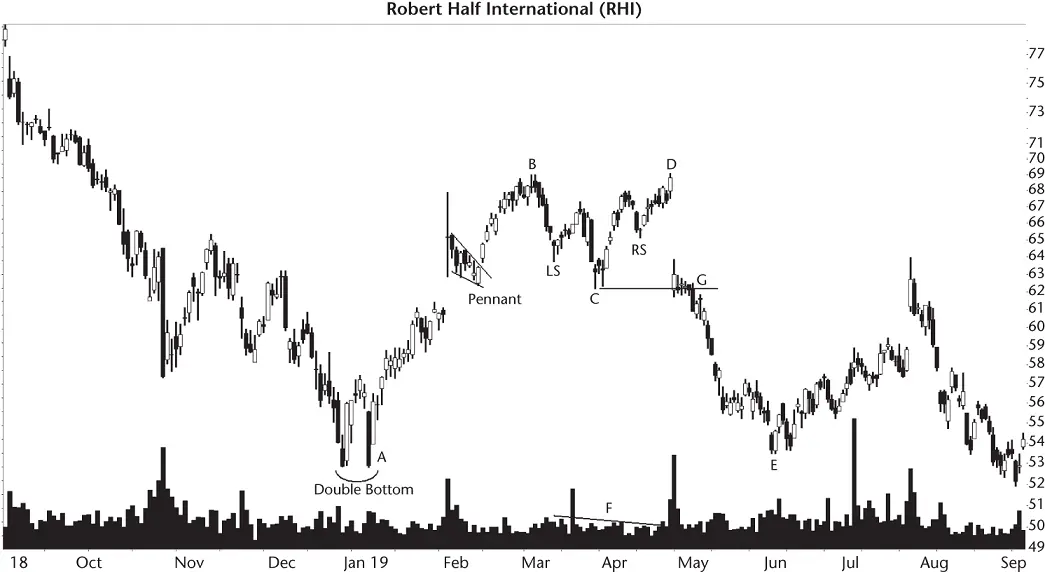
Figure 6.2 This big M (BD) struggles to find a bottom between the two peaks (where a head‐and‐shoulders bottom appears).
Between the two peaks, price forms a valley. I didn't set a limit on how far down the valley price slides, but the median height is about 12% in bull markets.
After the second peak, price drops, but often won't fall as steeply as it climbed on the rise to the first peak. In perfect patterns, the slope of the rise to the first peak will mirror the drop after the second peak, as I mentioned. In real life, it takes twice as long to drop from the second peak to the ultimate low as it did to climb from the launch price to the first peak.
Price trend.The price trend leading to the first peak should be unusually tall, often a straight‐line run up at a steep slope. As a good gauge, I looked at the height from the higher of the two peaks (D) to the valley between the two peaks (C). The upward trend leading to the first peak (A to B) should be a multiple of the peak to valley height (at least one times the height, but two times is better, CD).
Volume.Volume trends downward from the first to the second peak most often. Don't discard a big M pattern because it has a rising volume trend. Volume doesn't affect performance. We'll see that later in Table 6.6.
Breakout direction, confirmation.The pattern breaks out downward. A breakout happens when price closes below the low price of the valley between the two peaks. I show the breakout where price closes below line G.
A downward breakout confirms the big M as a valid chart pattern. If price does not break out downward, then you don't have a big M.
Duration.The length of the pattern, from peak to peak, varies from about a week to nearly a year (I often limit pattern width to 6 months, but the longest I cataloged was 254 days. I'm sure I can find wider ones), especially if I use a weekly scale (I prefer daily).
Focus on Failures
Figure 6.3shows what a big M failure looks like. Price begins a long climb at A toward peak B. The drop to C and recovery to the second peak, D, is typical for a big M. Contrast dip C with the sloppy head‐and‐shoulders valley in Figure 6.2.
So far, the chart pattern looks perfect, a textbook example of a big M. Let's look at the volume trend (G). It slopes upward. Uh‐oh . But a rising volume trend in a big M doesn't have any impact on performance, so who cares?
At E, price breaks out downward when it closes below C, confirming the big M pattern as a valid chart pattern. However, the stock bottoms at E.
What happened?
A trader shorting the stock would become a body on the way to the morgue if they didn't close out their trade promptly. Price steamrolled higher by 131% on its way to being taken over by another company in January 2020.
Notice the breakout day volume. I drew a line from the breakout (E) to the volume bar directly beneath (H). Yes, volume is higher on the breakout day, but it is less than the 1‐month average (according to my computer, and it's never lied…so far). The statistics say that breakout volume for big Ms doesn't help or hurt performance. So that's another yawn, and it's not really a performance clue, either.
Price rises after E and busts the downward breakout when it closes above the top of the pattern, at F (a breakaway gap). This is another example where bearish selling pressure wasn't high enough to overcome bullish buying demand. The bulls didn't buy like crazy and push price higher. That's clear from the anemic volume surrounding the breakout, but the stock moved up anyway.
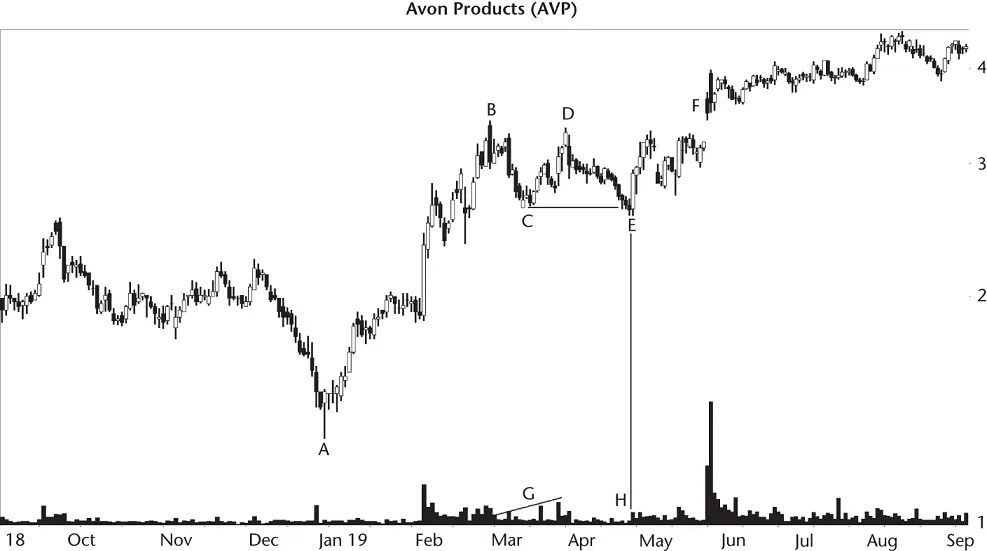
Figure 6.3 Price fails to drop more than 5% after the downward breakout.
The failure of this stock to stage a meaningful decline at E happens 14% of the time, and this is one example. A busted big M happens 38% of the time, so that's more alarming.
Let's talk more about numbers.
Statistics
Table 6.2shows general statistics for the big M. Notice that the tables are not split into up and down breakouts. That's because valid big Ms don't have upward breakouts, at least not in this universe.
Number found.I uncovered most big M patterns manually by searching through more than 1,700 stocks (finding big Ms in 772 stocks) from mid‐1991 to September 2019. I also automated finding them and checked each one to be sure they adhered to the ID guidelines. That process helped to unearth the stinkers like the one shown in Figure 6.3, where the pattern has a nice left‐side rise but a mutant right‐side decline.
Reversal (R), continuation (C) occurrence.All of the patterns acted as reversals of the uptrend by definition.
Average decline.Both bull and bear markets show performance that beats the average of all other chart patterns, but not by an amount that Mom would like to hear about, especially at three in the morning.
Standard & Poor's 500 change.Using the same hold time from the breakout to the ultimate low as the associated big M, we find that the big M dropped substantially more than the S&P 500 index. To put it another way, you can see how the general market helped the individual stocks perform.
Days to ultimate low.The median time to reach the ultimate low is a month for bull markets and about three weeks for bear markets. The table shows the average , which is longer in both bull and bear markets.
Speed trap?I checked price velocity and found that bear markets see price drop almost twice as fast as bull markets.
Читать дальшеИнтервал:
Закладка:
Похожие книги на «Encyclopedia of Chart Patterns»
Представляем Вашему вниманию похожие книги на «Encyclopedia of Chart Patterns» списком для выбора. Мы отобрали схожую по названию и смыслу литературу в надежде предоставить читателям больше вариантов отыскать новые, интересные, ещё непрочитанные произведения.


Обсуждение, отзывы о книге «Encyclopedia of Chart Patterns» и просто собственные мнения читателей. Оставьте ваши комментарии, напишите, что Вы думаете о произведении, его смысле или главных героях. Укажите что конкретно понравилось, а что нет, и почему Вы так считаете.