The Handbook of Speech Perception
Здесь есть возможность читать онлайн «The Handbook of Speech Perception» — ознакомительный отрывок электронной книги совершенно бесплатно, а после прочтения отрывка купить полную версию. В некоторых случаях можно слушать аудио, скачать через торрент в формате fb2 и присутствует краткое содержание. Жанр: unrecognised, на английском языке. Описание произведения, (предисловие) а так же отзывы посетителей доступны на портале библиотеки ЛибКат.
- Название:The Handbook of Speech Perception
- Автор:
- Жанр:
- Год:неизвестен
- ISBN:нет данных
- Рейтинг книги:4 / 5. Голосов: 1
-
Избранное:Добавить в избранное
- Отзывы:
-
Ваша оценка:
The Handbook of Speech Perception: краткое содержание, описание и аннотация
Предлагаем к чтению аннотацию, описание, краткое содержание или предисловие (зависит от того, что написал сам автор книги «The Handbook of Speech Perception»). Если вы не нашли необходимую информацию о книге — напишите в комментариях, мы постараемся отыскать её.
, Second Edition, is a comprehensive and up-to-date survey of technical and theoretical developments in perceptual research on human speech. Offering a variety of perspectives on the perception of spoken language, this volume provides original essays by leading researchers on the major issues and most recent findings in the field. Each chapter provides an informed and critical survey, including a summary of current research and debate, clear examples and research findings, and discussion of anticipated advances and potential research directions. The timely second edition of this valuable resource:
Discusses a uniquely broad range of both foundational and emerging issues in the field Surveys the major areas of the field of human speech perception Features newly commissioned essays on the relation between speech perception and reading, features in speech perception and lexical access, perceptual identification of individual talkers, and perceptual learning of accented speech Includes essential revisions of many chapters original to the first edition Offers critical introductions to recent research literature and leading field developments Encourages the development of multidisciplinary research on speech perception Provides readers with clear understanding of the aims, methods, challenges, and prospects for advances in the field
, Second Edition, is ideal for both specialists and non-specialists throughout the research community looking for a comprehensive view of the latest technical and theoretical accomplishments in the field.
The Handbook of Speech Perception — читать онлайн ознакомительный отрывок
Ниже представлен текст книги, разбитый по страницам. Система сохранения места последней прочитанной страницы, позволяет с удобством читать онлайн бесплатно книгу «The Handbook of Speech Perception», без необходимости каждый раз заново искать на чём Вы остановились. Поставьте закладку, и сможете в любой момент перейти на страницу, на которой закончили чтение.
Интервал:
Закладка:
Speech‐preferential areas
That areas of the brain exist that are necessary for the understanding of speech but not for general sound perception has been known since the nineteenth century, when the German neurologist Carl Wernicke associated the aphasia that bears his name with damage to the STG (Wernicke, 1874). Wernicke’s eponymous area was, incidentally, reinterpreted by later neurologists to refer only to the posterior third of the STG and adjacent parietal areas (Bogen & Bogen, 1976), although some disagreement about its precise boundaries continues until this day (Tremblay & Dick, 2016).
With the advent of fMRI at the end of the twentieth century, the posterior STG (pSTG) was confirmed to respond more strongly to vocal sounds than to nonvocal sounds (e.g. speech, laughter, or crying compared to the sounds of wind, galloping, or cars; Belin et al., 2000). Neuroimaging also revealed a second, anterior, area in the STG, which responds more to vocal than to nonvocal sounds (Belin et al., 2000). These voice‐preferential areas can be found in both hemispheres of the brain. Additional studies have shown that it is not just the voice but also intelligible speech that excites these regions, with speech processing being more specialized in the left hemisphere (Scott et al., 2000). Anatomically, the anterior and posterior STG receive white‐matter connections from the primary auditory cortex, and in turn feed two auditory‐processing streams, one antero‐ventral, which extends into the inferior frontal cortex, and the other postero‐dorsal, which curves into the inferior parietal lobule. The special function of these streams remains a matter of debate. For example, Rauschecker and Scott (2009) propose that the paths differ in processing what and where information in the auditory signal, where what refers to recognizing the cause of the sound (e.g. it’s a thunderclap) and where to locating the sound’s spatial location (e.g. to the west). Another, more linguistic, suggestion is that the ventral stream is broadly semantic, whereas the dorsal stream may be described as more phonetic in nature (Hickok & Poeppel, 2004). Whatever the functions, however, there appear to be two streams diverging around the anterior and posterior STG.
Over the years, these early STG results have been replicated many times using neuroimaging (Price, 2012). Each technique for observing activity of the human brain, whether it is noninvasive magnetoencephalography (MEG) or fMRI, or invasive surgical techniques such electrocorticography (ECoG; described in the next section), all have their limitations and shortcomings. It is therefore reassuring that the insights into the neuroanatomy of speech comprehension established by methods like MEG or fMRI, which can image the whole brain, are both confirmed and extended by studies using targeted surgical techniques like ECoG.
Auditory phonetic representations in the superior temporal gyrus
ECoG, which involves the placement of electrodes directly onto the surface of the brain, cannot easily record from the primary auditory cortex. This is because the PAC is tucked away inside the Sylvian fissure, along the dorsal aspect of the temporal lobe. At the same time, because ECoG measures the summed postsynaptic electrical current of neurons with millisecond resolution, it is sensitive to rapid neural responses at the timescale of individual syllables, or even individual phones. By contrast, fMRI measures hemodynamic responses; these are changes in blood flow that are related to neural activity but occur on the order of seconds. In recent years, the use of ECoG has revolutionized the study of speech in auditory neuroscience. An exemplar of this can be found in a recent paper (Mesgarani et al., 2014).
Mesgarani et al. (2014) used ECoG to learn about the linguistic‐phonetic representation of auditory speech processing in the STG of six epileptic patients. These patients listened passively to spoken sentences taken from the TIMIT corpus (Garofolo et al., 1993), while ECoG was recorded from their brains. These ECoG recordings were then analyzed to discover patterns in the neural responses to individual speech sounds (for a summary of the experimental setup, see Figure 3.7, panels A–C). The authors used a phonemic analysis of the TIMIT dataset to group the neural responses at each electrode, according to the phoneme that caused it. For examples, see panel D of Figure 3.7, which allows the comparison of responses to different speech sounds for a number of different sample electrodes labeled e1 to e5. The key observation here is that an electrode such as e1 gives similar responses for /d/ and /b/ but not for /d/ and /s/, and that the responses at each of the electrodes shown will respond strongly for some groups of speech sounds but not others. Given these data, we can ask the question: Do STG neurons group, or classify, speech segments through the similarity of their response patterns? And, if so, which classification scheme do they use?
Linguists and phoneticians often analyze individual speech sounds into feature classes, based, for example, on either the manner or the place of articulation that is characteristic for that speech act. Thus, /d/, /b/, and /t/ are all members of the plosive manner‐of‐articulation class because they are produced by an obstruction followed by a sudden release of air through the vocal tract, and /s/ and /f/ belong to the fricative class because both are generated by turbulent air hissing through a tight constriction in the vocal tract. At the same time, /d/ and /s/ also belong to the alveolar place‐of‐articulation class because, for both phonemes, the tip of the tongue is brought up toward the alveolar ridge just behind the top row of the teeth. In contrast, /b/ has a labial place of articulation because to articulate /b/ the airflow is constricted at the lips. Manner features are often associated with particular acoustic characteristics. Plosives involve characteristically brief intervals of silence followed by a short noise burst, while fricatives exhibit sustained aperiodic noise spread over a wide part of the spectrum. Classifying speech sounds by place and manner of articulation is certainly very popular among speech scientists, and is also implied in the structure of the International Phonetic Alphabet (IPA), but it is by no means the only possible scheme. Speech sounds can also be described and classified according to alternative acoustic properties or perceptual features, such as loudness and pitch. An example feature that is harder to characterize in articulatory or acoustic terms is sonority. Sonority defines a scale of perceived loudness (Clements, 1990) such that vowels are the most sonorous, and glides are the next most sonorous, followed by then liquids, nasals, and finally obstruents (i.e. fricatives and plosives). Despite the idea of sonority as a multitiered scale, phonemes are sometimes lumped into two groups of sonorant and nonsonorant , with everything but the obstruents counting as sonorants.
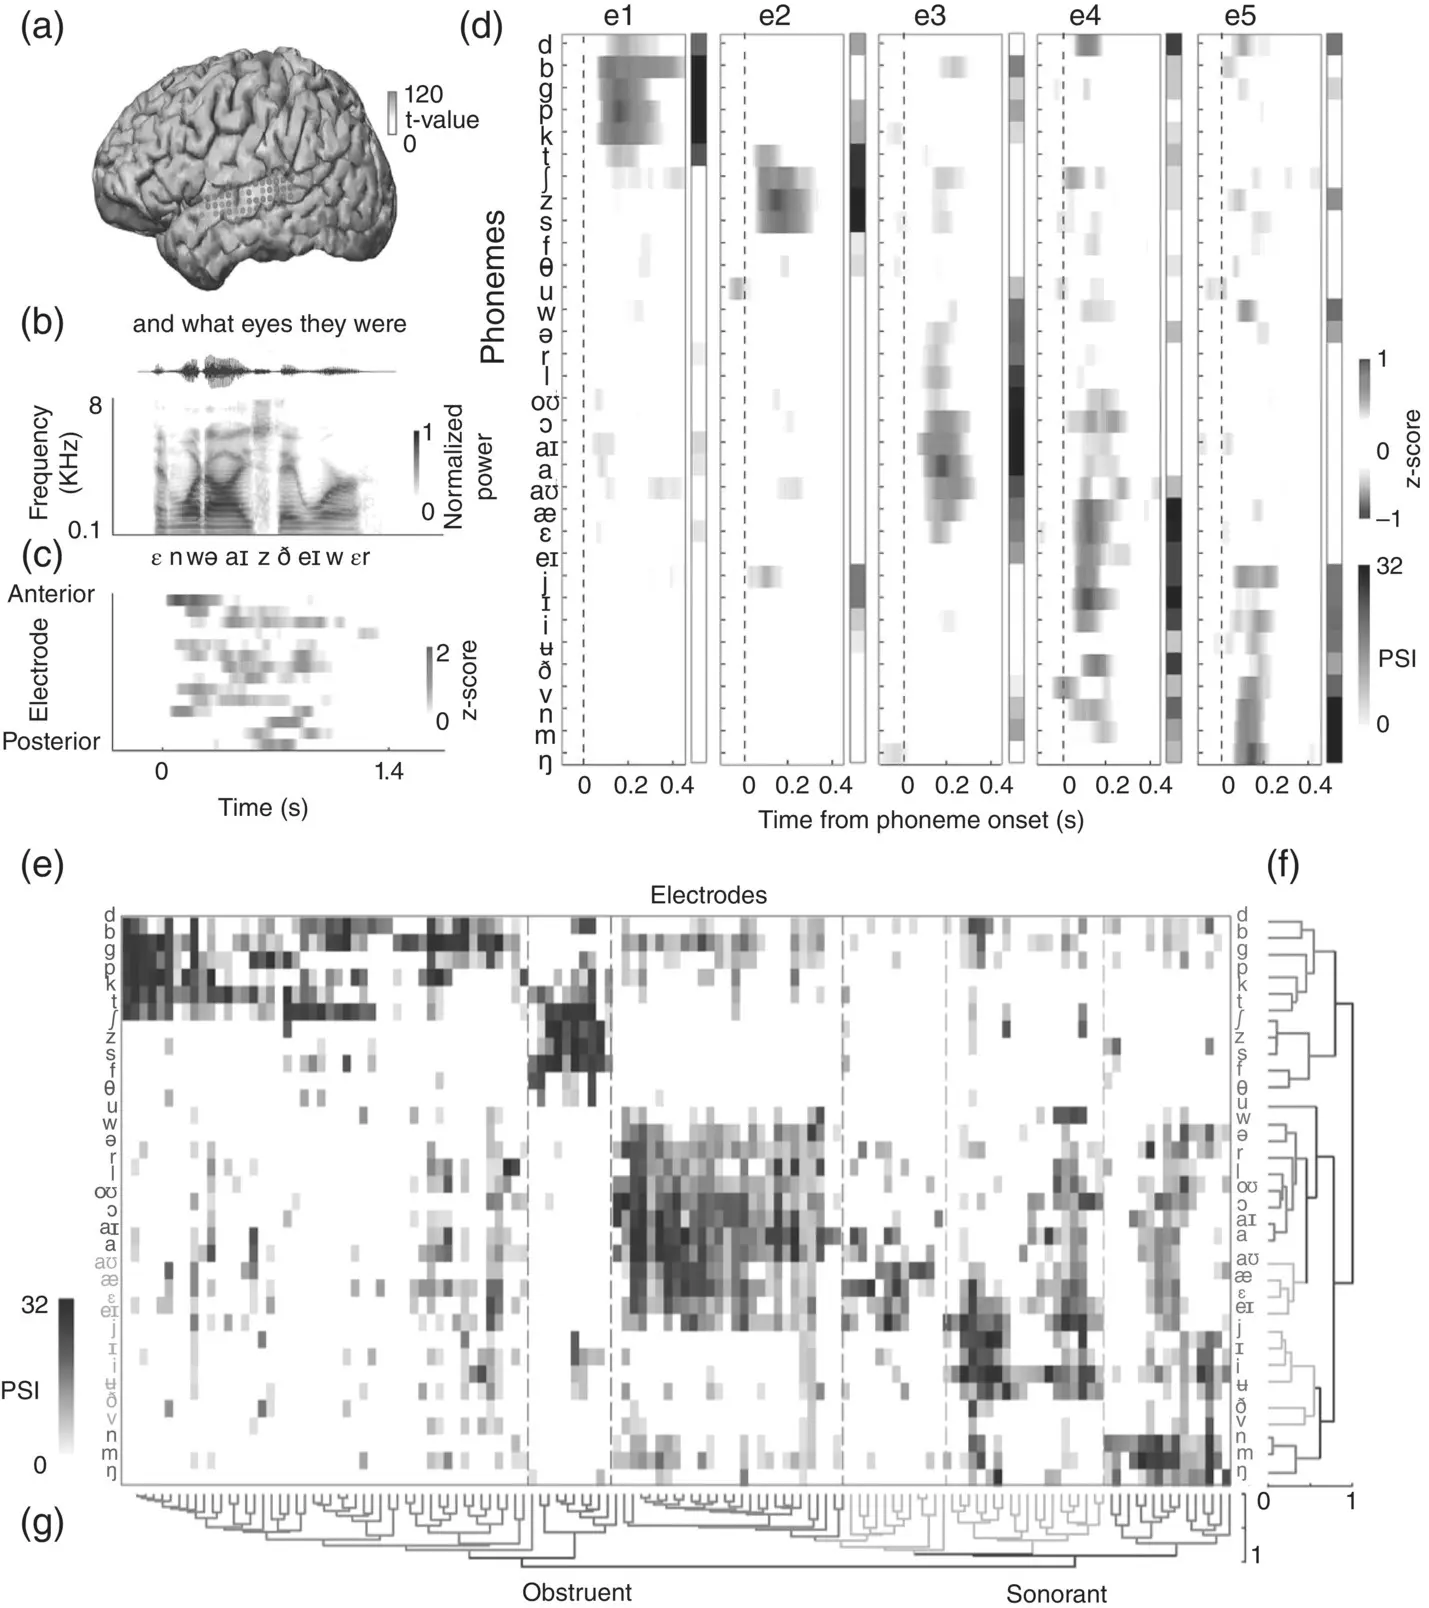
Figure 3.7 Feature‐based representations in the human STG. (a) shows left‐hemisphere cortex with black dots indicating ECoG electrodes. (b) shows an example acoustic stimulus ( and what eyes they were ), including orthography, waveform, spectrogram, and IPA transcription. (c) shows time‐aligned neural responses to the acoustic stimulus. The electrodes (y‐axis) are sorted spatially (anterior to posterior), with time (in seconds) along the x‐axis. (d) shows sample phoneme responses by electrode. For five electrodes (e1 to e5), the plots show cortical selectivity for English phonemes (y‐axis) as a function of time (x‐axis), with phoneme onsets indicated by vertical dashed lines. The phoneme selectivity index (PSI) is a summary over time of how selective the cortical response is for each phoneme. (e) shows phoneme responses (PSIs) for all electrodes, arranged for hierarchical clustering analyses. (f) and (g) show clustering analyses by phoneme and by electrode. These show how phonemes and electrodes are grouped, respectively, with reference to phonetic features. For example, (f) shows that electrodes can be grouped by selectivity to obstruents and sonorants.
Читать дальшеИнтервал:
Закладка:
Похожие книги на «The Handbook of Speech Perception»
Представляем Вашему вниманию похожие книги на «The Handbook of Speech Perception» списком для выбора. Мы отобрали схожую по названию и смыслу литературу в надежде предоставить читателям больше вариантов отыскать новые, интересные, ещё непрочитанные произведения.


![О Генри - Справочник Гименея [The Handbook of Hymen]](/books/407356/o-genri-spravochnik-gimeneya-the-handbook-of-hymen-thumb.webp)


Обсуждение, отзывы о книге «The Handbook of Speech Perception» и просто собственные мнения читателей. Оставьте ваши комментарии, напишите, что Вы думаете о произведении, его смысле или главных героях. Укажите что конкретно понравилось, а что нет, и почему Вы так считаете.