Biosurfactants for a Sustainable Future
Здесь есть возможность читать онлайн «Biosurfactants for a Sustainable Future» — ознакомительный отрывок электронной книги совершенно бесплатно, а после прочтения отрывка купить полную версию. В некоторых случаях можно слушать аудио, скачать через торрент в формате fb2 и присутствует краткое содержание. Жанр: unrecognised, на английском языке. Описание произведения, (предисловие) а так же отзывы посетителей доступны на портале библиотеки ЛибКат.

- Название:Biosurfactants for a Sustainable Future
- Автор:
- Жанр:
- Год:неизвестен
- ISBN:нет данных
- Рейтинг книги:5 / 5. Голосов: 1
-
Избранное:Добавить в избранное
- Отзывы:
-
Ваша оценка:
Biosurfactants for a Sustainable Future: краткое содержание, описание и аннотация
Предлагаем к чтению аннотацию, описание, краткое содержание или предисловие (зависит от того, что написал сам автор книги «Biosurfactants for a Sustainable Future»). Если вы не нашли необходимую информацию о книге — напишите в комментариях, мы постараемся отыскать её.
A thorough introduction to the state-of-the-art in biosurfactant technology, techniques, and applications An exploration of biosurfactant enhanced remediation of sediments contaminated with organics and inorganics A discussion of perspectives for biomedical and biotechnological applications of biosurfactants A review of the antiviral, antimicrobial, and antibiofilm potential of biosurfactants against multi-drug-resistant pathogens. An examination of biosurfactant-inspired control of methicillin-resistant staphylococcus aureus Perfect for academic researchers and scientists working in the petrochemical industry, pharmaceutical industry, and in the agroindustry,
will also earn a place in the libraries of scientists working in environmental biotechnology, environmental science, and biomedical engineering.
Biosurfactants for a Sustainable Future — читать онлайн ознакомительный отрывок
Ниже представлен текст книги, разбитый по страницам. Система сохранения места последней прочитанной страницы, позволяет с удобством читать онлайн бесплатно книгу «Biosurfactants for a Sustainable Future», без необходимости каждый раз заново искать на чём Вы остановились. Поставьте закладку, и сможете в любой момент перейти на страницу, на которой закончили чтение.
Интервал:
Закладка:
Among the other definitions for cmc analyzed by Rusanov we would like to remark on the following one. The focus is on a system in which micelles are composed of a single sort of particle. For further details and the analysis of more complex systems, the two papers by Rusanov [94] are recommended.
Let us redefine the Grindley and Bury [45] equilibrium constant as
(1.13) 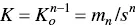
The equilibrium constant K owould correspond to a hypothetical single step in which a virtual aggregate m jis formed by the binding of an additional monomer to a virtual aggregate of size m j‐1according to
(1.14) 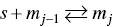
its equilibrium constant being
(1.15) 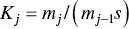
The isodesmic model accepts that all K jconstants are equal to K o. The difference with the Grindley and Bury equilibrium constant comes from the fact that only ( n – 1) steps are required to form a micelle with n monomers. Interestingly, in 1935 Goodeve [99] have pointed out that forming micelles of, say, about 20 molecules must pass through all the intermediate stages of association. The formation of the micelles from the monomer in one stage is, of course, highly improbable as it requires “a collision of 20 molecules at one time.” Goodeve presented Eq. (1.14)as representing the equilibrium according to this point of view.
Equation (1.13)is better understood in the form
(1.16) 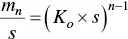
where K oand s are both positive, n is usually large, and, independently of the value of n , for K o × s = 1, the concentration of micelles and monomers are the same. Deviations of the product K o × s from that value lead to either m n< s or m n> s . For instance, for n = 50, the ratio m n/ s changes by a factor 1.86 × 10 4when K o × s varies from 0.9 to 1.1. This is in fact the analysis by Grindley and Bury [45].
This suggests a definition of cmc by the condition
(1.17) 
and from the conservation of material ( S t= s + n × m n) it follows that at cmc S t,cmc = ( n + 1 ) s cmc = ( n + 1) m n.
From Eq. (1.16)it also follows that
(1.18) 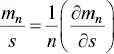
or
(1.19) 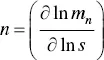
In a monodisperse system, this equation may be simplified to
(1.20) 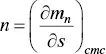
since at cmc , m n= s and n is constant for the whole range of surfactant concentrations. Thus, the larger the rate of change of the micelle concentration is with respect to the change in the monomer concentration, the higher the aggregation number will be.
Once the equilibrium constant and the aggregation number are known, all the thermodynamic functions may be obtained. These thermodynamic quantities have traditionally been determined from the measurement of cmc at different temperatures, the range of temperatures being around 40 °C (or less). The problem is that the dependence of the cmc with temperature is usually low for most of the surfactants and, as the dependence of Δ G owith the concentration is logarithmic, the range of experimental values is even shorter. This introduces an error in the determination of the thermodynamic amounts, which is necessarily rather high.
The commercial introduction of high quality isothermal titration calorimeters has provided a routine way for the determination of previous amounts, which have a much higher precision. In a typical measurement a sample cell is filled with water (or any other appropriate solvent). A surfactant solution is placed in a syringe, which allows the injection of small aliquots into the sample cell at different intervals of time. The solvent of this solution and the one filling the sample cell must be identical to prevent some effects as the dilution heat of inert salts or buffers. The concentration of the surfactant ranges from 10 to 30 times the cmc value. Each injection increases the surfactant concentration in the sample cell from zero to a concentration clearly above the cmc . The heat involved in the process (the concentration in the syringe is always higher than in the sample cell) after each injection is measured and plotted vs the increasing concentration in the sample cell. Figure 1.4imitates a typical enthalpogram and its derivative. In this case, ϕ = Δ H (in kJ/mol of injectant) is the involved heat after each injection.
An ideal enthalpogram can be subdivided into three concentration ranges. In region I (first injections, till point A in Figure 1.4) the increasing concentration in the cell is still below the cmc . Here, the large enthalpic effects observed are mainly due to breaking micelles into monomers (demicellization process) and dilution of monomers [92]. In region III (final injections, after point C in Figure 1.4), the increasing concentration in the cell is above the cmc . Here, the low enthalpic effects observed are mainly due to dilution of micelles. In the central region (between A and C in Figure 1.4), a sharp decrease is observed and corresponds to a transition from reaching the cmc and exceeding it. Therefore, the cmc corresponds to the inflection point of the curve, which can easily be determined as the first derivative of the curve ( Eq. (1.11), Figure 1.4, right). The heat of demicellization Δ H demicis equal to the enthalpy difference between the two extrapolated lines in Figure 1.4. Thus, the cmc and the enthalpy of micellization are simultaneously determined, but independently to each other.
Repetition of the ITC experiment at other temperatures allows the determination of the change in the heat capacity of the demicellization process,  . The interval of temperatures used in these studies is rarely larger than 30–40 °C. Within this interval, the dependence of Δ H demicfor most of the surfactants is linear with T, meaning that
  is constant ([100] and references therein). While Δ H demicmay be either positive (endothermic) or negative (exothermic),
  for the demicellization process is always positive. This means that the hydrophobic surface of monomers, being exposed to water, increases upon demicellization. For this reason, it is frequently observed that Δ H demicis negative at low temperatures and positive at high ones. The formation of a micelle requires that some water molecules surrounding each monomer must be lost in the aggregation process to form the final aggregate. The process also contributes to a favorable entropy term for micellization. Thus, the transfer of surfactant monomers from an aggregate to the bulk water has many facts in common with the dissolution of liquid alkanes into water [101]. Gill et al. [102] have noticed that the experimental heat capacity difference between gaseous and dissolved non‐polar molecules in water is correlated with the number of water molecules in the first solvation shell. They concluded that a two‐state model, in which each water molecule in the solvation shell behaves independently, provides a satisfactory basis to quantitatively describe the heat capacity properties of the solvation shell. For a series of solutes (most of them being hydrocarbon compounds), an average value of ~13.3 J/mol K (see the theoretical line shown in Figure 1.1at 25 °C of that paper) was estimated for the contribution of each water molecule to
  .
.
Интервал:
Закладка:
Похожие книги на «Biosurfactants for a Sustainable Future»
Представляем Вашему вниманию похожие книги на «Biosurfactants for a Sustainable Future» списком для выбора. Мы отобрали схожую по названию и смыслу литературу в надежде предоставить читателям больше вариантов отыскать новые, интересные, ещё непрочитанные произведения.


Обсуждение, отзывы о книге «Biosurfactants for a Sustainable Future» и просто собственные мнения читателей. Оставьте ваши комментарии, напишите, что Вы думаете о произведении, его смысле или главных героях. Укажите что конкретно понравилось, а что нет, и почему Вы так считаете.