Digital Cities Roadmap
Здесь есть возможность читать онлайн «Digital Cities Roadmap» — ознакомительный отрывок электронной книги совершенно бесплатно, а после прочтения отрывка купить полную версию. В некоторых случаях можно слушать аудио, скачать через торрент в формате fb2 и присутствует краткое содержание. Жанр: unrecognised, на английском языке. Описание произведения, (предисловие) а так же отзывы посетителей доступны на портале библиотеки ЛибКат.
- Название:Digital Cities Roadmap
- Автор:
- Жанр:
- Год:неизвестен
- ISBN:нет данных
- Рейтинг книги:4 / 5. Голосов: 1
-
Избранное:Добавить в избранное
- Отзывы:
-
Ваша оценка:
Digital Cities Roadmap: краткое содержание, описание и аннотация
Предлагаем к чтению аннотацию, описание, краткое содержание или предисловие (зависит от того, что написал сам автор книги «Digital Cities Roadmap»). Если вы не нашли необходимую информацию о книге — напишите в комментариях, мы постараемся отыскать её.
On the other hand, this book also deals with energy consumption. Such energy consumption leads to a rapid depletion of energy resources, an increased need for building maintenance, an improvised comfortable lifestyle, and an increase in time spent on building construction. A sustainable building mainly explains the renewable sources used for construction, which helps the structure withstand atmospheric changes. Currently, all countries are looking for ecological materials, that is, renewable plant materials such as straw and clay bricks, wood from forests certified for sustainable management, recycled materials, and other non-toxic, reusable and renewable products. For sustainable and durable construction, energy efficiency is an urgent problem, and researchers are currently actively involved in this area. This book will provide an in-depth analysis of design technologies that lay a solid foundation for sustainable buildings. The book also highlights smart automation technologies that help save energy, as well as various performance indicators needed to make construction easier. The book aims to create a strong research community, to have a deep understanding and the latest knowledge in the field of energy and comfort, to offer solid ideas in the nearby future for sustainable and resilient buildings. These buildings will help the city grow as a smart city. The smart city has also focused on low energy consumption, renewable energy, and small carbon footprints. To find the optimal use of energy resources, researchers must study optimization methods.
Digital Cities Roadmap — читать онлайн ознакомительный отрывок
Ниже представлен текст книги, разбитый по страницам. Система сохранения места последней прочитанной страницы, позволяет с удобством читать онлайн бесплатно книгу «Digital Cities Roadmap», без необходимости каждый раз заново искать на чём Вы остановились. Поставьте закладку, и сможете в любой момент перейти на страницу, на которой закончили чтение.
Интервал:
Закладка:
Figure 1.3Decision making resilience and sustainable development framework.
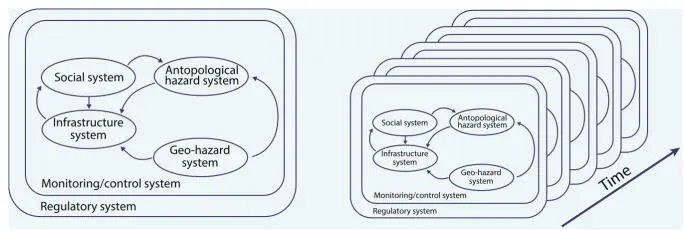
Figure 1.4Bavarian decision analytics.
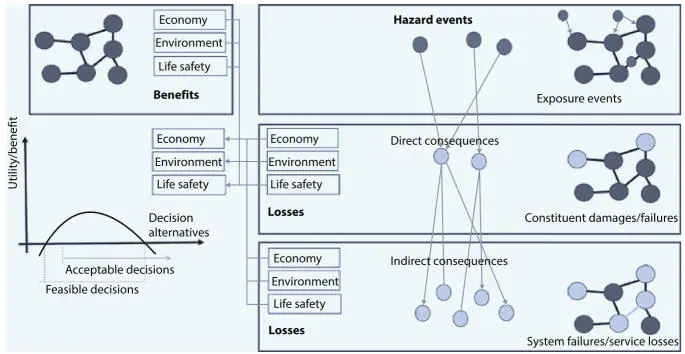
Figure 1.5Framework system modeling.
1.5.2. Exposures and Disturbance Events
As seen in Figure 1.5, exposure incidents (disturbances) are considered to reflect, in theory, all future occurrences that may have implications. Resiliency, ecological models and analyses can include exposures.
Type-1 Hazards: The related threats are manageable in broad enough time and room, rendering their management far simpler. Geohazards such as earthquakes, flooding, waves, etc. are common manifestations of this form of hazards [37, 41, 43, 44].
Type-2 Hazards: They may be correlated with catastrophic combined effects on adequate time and space scales. Furthermore, their cumulative effects may cause the same characteristics as the hazards of type 3 to have more disastrous consequences. Typical cases include biological pollution, misuse of land, plant destruction, ineffective or poor management, insufficient financial planning, human mistakes, etc.
Type-3 Hazards: Very unusual and possibly catastrophic occurrences, also in broad sections of time and space, that are unforeseen and about which little evidence is practically available. The cumulative effects of type 2 hazards may be triggered. Examples include volcano eruptions, meteor collisions, solar storms of extreme severity, rapid temperature change as well as significant terrorist activities.
1.5.3 Quantification of Resilience
The literature includes a fairly wide number of ideas for modeling and quantifying network durability, e.g. Cimellaro et al. [60], Linkov et al. [59], Sharma et al. [61] and Tamvakis and Xenedis [62]. The proposed models are more commonly aimed at the short-term reflection of the system’s capacity to withstand and rebound from disruptions, without major output loss and without outside assistance, usually, the emphasis on the portrayal of resilience models.
For impact on service delivery of the stated perturbations and on recovery characteristics in relation to service grade recovered against period and overall service failure, see Figure 1.6.
Until recently only the modeling of processes to rebound from disruptions has been granted tacit attention. Neither the functional failure nor rather the production of capability that is critical to the productive, yet quick reorganization, change, yet recovery following disruptions and danger events will take account of processes flexibility providing a life cycle gain in the flexibility model described in Faber and Qin [57]. See Figure 1.6.
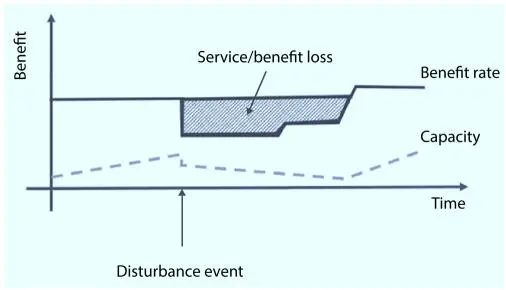
Figure 1.6Quantification of resilience.
1.5.4 Quantification of Sustainability
Addressing biodiversity includes a shared analysis of the implications of inter-generational and intra-generational inequality on the environment, public safety and wellbeing, financial circumstances and extension of natural capital [45, 46, 48, 49]. In relation to the consequences currently discussed in resilience models, the emphasis is on whether changes on the ecosystem should be taken into consideration.
The theory behind this is to extend the Planetary Boundaries principle as a way to reflect the Earth‘s capabilities which are essential to continuing social growth, as we know it today. The Planet Life Support System (ELSS) is the following features of the Earth system. It is often believed that device states and the associated effects linked to the effect on the environmental quality, which put strain on the ELSS, may be attributed to every alternate decision concerning the configuration and the management of an integrated system. This relationship may be built in the sense of product production following Hauschild [63], by Life Cycle Analysis, as implemented in support of QSAs. Figure 1.7 demonstrates the definition.
Another important point of this article is that due to lack of knowledge and inherent natural variability the resilience and sustainability of engineered systems can only be proven and probabilistically modeled in a meaningful way. As a result, resilience and sustainability criteria need to be described in terms, for example, of appropriate annual resilience probabilities and sustainability failures. It quickly becomes apparent from this point of view that tradeoffs occur.

Figure 1.7Mapping of quantification of sustainability and resilience.
The problem of how robust built structures and efficient society innovations should be taken into consideration when choosing. The short-term social security may rely on what are perceived as appropriate threats linked to local adaptation failures (e.g. at neighborhood level) as well as society’s tolerance for the possibility of global mitigation failures. In order to promote effective and educated collective decision-making, more work on this solution will be carried out to the immediate future.
1.6 Community and Quantification Metrics, Resilience and Sustainability Objectives
The impact of natural (and anthropogenic) dangers can be significant in communities. Objectives must be described in terms of their appropriate after-effects. Resilience and sustainability objectives can be defined explicitly in assessing the impact on the well-being of recovery times, environmental justice, and social justice (i.e., international and inter-generational justice) [58]. We ought to identify quantification measures to assess the effect of a harmful occurrence on the well-being. These quantification indicators may be described at various intervals in order to reflect improvements in the health directly after and after the rehabilitation period, even until a danger arises [55, 64]. The individual’s well-being is dynamic and relies on several aspects, including resources, social expectations and socioeconomic status that are open to the society. Social standards and status are commonly referred to as factors of social vulnerability [71]. Such principles ought to compensate for priorities and quantification in order to correctly forecast and measure the impact of a natural catastrophe on health (Figure 1.8).
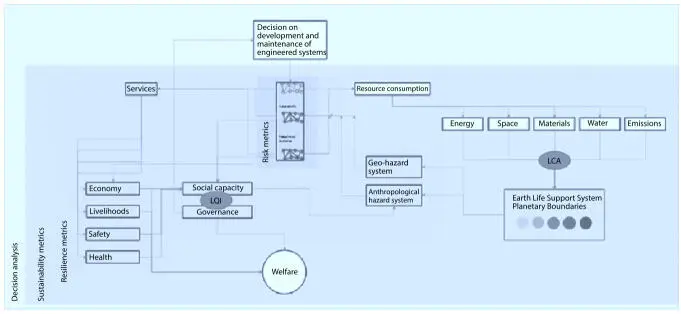
Figure 1.8Techniques of quantification of sustainability and resilience [58].
1.6.1 Definition of Quantification Metric
These indicators can be measured by means of the disaster impact and the recuperation as quantification metrics for the various capacities and functions. Issues of data access make ideal metrics and regressors challenging to create. For starters, the household regressors are usually desirable. Nonetheless, socio-economic details including employment, ethnicity or age is also not accessible at the household level. Furthermore, the nature of the capacities makes it harder to identify a measure that is always indicative in the context of disparities within populations and infrastructure roles and socio-economic conditions before a harmful event occurs. For example, access to clean water in a developed country can provide a desired indicator, whereas it may be more useful to study different sources of drinking water, for example water tanks or wells in a developing country. Indicators will also be chosen on the grounds of data quality and importance to the area of concern. For the development of exact predictive models, the collection of data sources for indicators/regressors is important. In order for models to be used in the future, the data source should be reliable and frequently actualized. The US census, which is frequently revised and freely accessible, may be an indicator of a data base. If real-time data is available, updates to Bayesian models can be used.
Читать дальшеИнтервал:
Закладка:
Похожие книги на «Digital Cities Roadmap»
Представляем Вашему вниманию похожие книги на «Digital Cities Roadmap» списком для выбора. Мы отобрали схожую по названию и смыслу литературу в надежде предоставить читателям больше вариантов отыскать новые, интересные, ещё непрочитанные произведения.
![Чарльз Диккенс - A Tale of Two Cities [С англо-русским словарем]](/books/26616/charlz-dikkens-a-tale-of-two-cities-s-anglo-thumb.webp)


Обсуждение, отзывы о книге «Digital Cities Roadmap» и просто собственные мнения читателей. Оставьте ваши комментарии, напишите, что Вы думаете о произведении, его смысле или главных героях. Укажите что конкретно понравилось, а что нет, и почему Вы так считаете.