John E. Boylan - Intermittent Demand Forecasting
Здесь есть возможность читать онлайн «John E. Boylan - Intermittent Demand Forecasting» — ознакомительный отрывок электронной книги совершенно бесплатно, а после прочтения отрывка купить полную версию. В некоторых случаях можно слушать аудио, скачать через торрент в формате fb2 и присутствует краткое содержание. Жанр: unrecognised, на английском языке. Описание произведения, (предисловие) а так же отзывы посетителей доступны на портале библиотеки ЛибКат.
- Название:Intermittent Demand Forecasting
- Автор:
- Жанр:
- Год:неизвестен
- ISBN:нет данных
- Рейтинг книги:5 / 5. Голосов: 1
-
Избранное:Добавить в избранное
- Отзывы:
-
Ваша оценка:
Intermittent Demand Forecasting: краткое содержание, описание и аннотация
Предлагаем к чтению аннотацию, описание, краткое содержание или предисловие (зависит от того, что написал сам автор книги «Intermittent Demand Forecasting»). Если вы не нашли необходимую информацию о книге — напишите в комментариях, мы постараемся отыскать её.
The first text to focus on the methods and approaches of intermittent, rather than fast, demand forecasting
Intermittent Demand Forecasting No prior knowledge of intermittent demand forecasting or inventory management is assumed in this book. The key formulae are accompanied by worked examples to show how they can be implemented in practice. For those wishing to understand the theory in more depth, technical notes are provided at the end of each chapter, as well as an extensive and up-to-date collection of references for further study. Software developments are reviewed, to give an appreciation of the current state of the art in commercial and open source software.
“Intermittent demand forecasting may seem like a specialized area but actually is at the center of sustainability efforts to consume less and to waste less. Boylan and Syntetos have done a superb job in showing how improvements in inventory management are pivotal in achieving this. Their book covers both the theory and practice of intermittent demand forecasting and my prediction is that it will fast become the bible of the field.” —
, Professor, University of Nicosia, and Director, Institute for the Future and the Makridakis Open Forecasting Center (MOFC).
“We have been able to support our clients by adopting many of the ideas discussed in this excellent book, and implementing them in our software. I am sure that these ideas will be equally helpful for other supply chain software vendors and for companies wanting to update and upgrade their capabilities in forecasting and inventory management.”—
, VP, Research and Development, Blue Yonder.
“As product variants proliferate and the pace of business quickens, more and more items have intermittent demand. Boylan and Syntetos have long been leaders in extending forecasting and inventory methods to accommodate this new reality. Their book gathers and clarifies decades of research in this area, and explains how practitioners can exploit this knowledge to make their operations more efficient and effective.”—
, Professor Emeritus, Rensselaer Polytechnic Institute.
Intermittent Demand Forecasting — читать онлайн ознакомительный отрывок
Ниже представлен текст книги, разбитый по страницам. Система сохранения места последней прочитанной страницы, позволяет с удобством читать онлайн бесплатно книгу «Intermittent Demand Forecasting», без необходимости каждый раз заново искать на чём Вы остановились. Поставьте закладку, и сможете в любой момент перейти на страницу, на которой закончили чтение.
Интервал:
Закладка:
It is instructive to repeat these calculations for an OUT level of eight units. In this case, Sobel's formula gives a fill rate of 93.8%, which is exactly the same as the traditional formula (see Table 3.8). The reason is that, in this case, the maximum demand over the lead time (eight units) can deplete the stock to zero but cannot result in a backorder situation. Therefore, there will be no double counting of backorders from past periods.
Sobel's formula ( Eq. (3.4)) is based on reviews every period (  ). Zhang and Zhang (2007) presented a fill rate formula which applies for any whole‐number length of review interval (
  ). This formula is given in Technical Note 3.1, together with an explanation of its components. The formula applies for the
  periodic inventory policy, which has been our main focus of attention. Teunter (2009) extended this analysis to the continuous
  policy. There are further refinements to fill rate calculations for normally distributed demands that are not independent or when negative demands are permitted (interpreted as returns). The interested reader is referred to Disney et al. (2015) for a more detailed discussion.
3.6.4 Summary
In some ways, the fill rate is the most natural service measure for intermittent demand. The concept is straightforward to explain to managers and is often used in practice. However, the implementation of the fill rate calculation raises some technical issues. Adjustments are needed to avoid double counting of backorders. Although these adjustments do make the calculation more complex, they may be beneficial, particularly for those items with lumpy demand patterns. The formulae given in this section and in Technical Note 3.1require distributions of demand over the lead time or longer. If the demand is assumed to be independent and identically distributed, then these distributions may be obtained from the distribution of demand per period. Selecting this distribution will become our focus of attention in Chapters 4and 5.
3.7 Setting Service Level Targets
Once a choice of measure has been made, there is a need to set targets that appropriately reflect the organisation's broader goals. These may be applied universally, across all SKUs, or differentially, for different categories of SKUs. The setting of these targets is the subject of this section.
3.7.1 Responsibility for Target Setting
Who should be responsible for setting service level targets? Often, the sales department is allocated this responsibility. Snapp (2018) suggested that this may be misguided because sales people may not be fully aware of the supply chain implications of a change in the target service level. Similarly, the supply chain department may be unaware of the competitive implications in the market. Snapp recommended a cross‐functional approach, for example in a sales and operations planning (S&OP) process, to overcome silo‐oriented target service level setting. (Please refer to Jandhyala et al. 2018, for further information on S&OP.)
3.7.2 Trade‐off Between Service and Cost
At what levels should service level targets be set? This is not an easy question to answer. Nevertheless, if an organisation is clear on the priority level of inventory service as part of its positioning, and the costs it is prepared to bear, then it is in a good position to set service level targets strategically.
An assessment of service level options should be informed by an evaluation of the trade‐off between service level and cost. It is here that well‐designed inventory systems can be very helpful. An early example was given by Johnston (1980), who designed an interactive stock control system for builders' merchants. He included a facility to allow managers to experiment with alternative stocking strategies, using the system to provide estimates of the anticipated average stock values, stock turns, service levels, and expected lost sales per annum. This type of analysis can enable exchange curves to be drawn, such as that illustrated in Figure 3.2.
Figure 3.2shows an example of the trade‐off between fill rates and average inventory values. Curves such as this can be drawn for whole categories of stocks for which different service level targets may be applied. For example, separate analyses could be conducted for fast, medium, and slow‐moving SKUs and service level targets set accordingly for each stock category.
Exchange curves can be drawn only if the inventory system allows the simulation of inventories with different service level targets. At a higher strategic level, it is possible to design systems to allow experimentation on service level targets at a stocking location, or to examine the stock implications of merging two stocking points (Johnston et al. 1988).
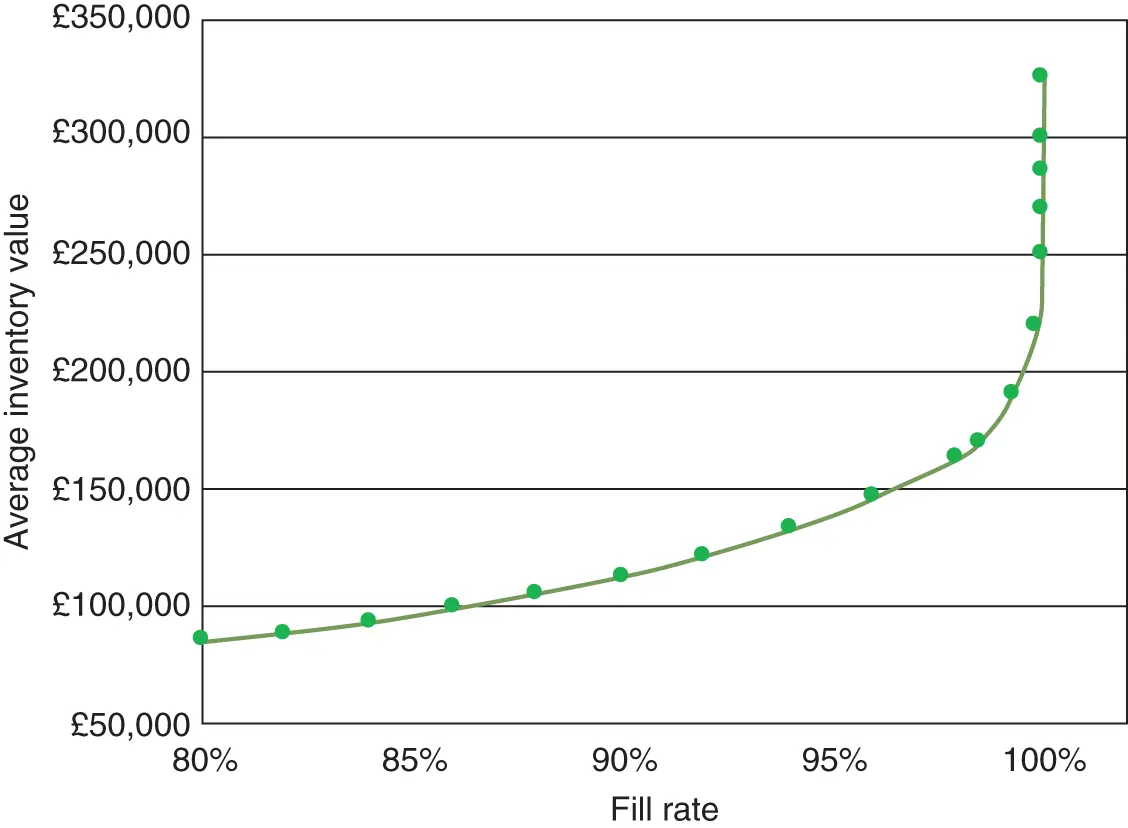
Figure 3.2 Exchange curve.
3.7.3 Setting SKU Level Service Targets
It is natural to define fill rates in the same way at aggregate and SKU levels. Then, it is clear that fill rate targets set at an aggregate level can also be applied at SKU level. As previously mentioned, these targets can be set differentially by stock category.
An alternative approach is to treat the items in a class separately if they have different unit costs. Thonemann et al. (2002) presented a model to reduce the overall stock costs by assigning higher fill rate targets to lower cost items and lower fill rate targets to higher cost items, while ensuring that the overall fill rate target is met. Other authors (Zhang et al. 2001; Teunter et al. 2010, 2017) have proposed approaches based on ranking SKUs, using various criteria, and then treating the SKUs differentially. Some of these approaches will be reviewed in Chapter 11.
Systems having the facility to experiment with service level targets at the level of the individual SKU are available (for example, at the time of writing, RightStock from DBO Services and the Inventory Planner of Arkieva). In Figure 3.3we show a screenshot of the Inventory Strategist function from RightStock.
In the example given in Figure 3.3, the current system target cycle service level is set to 95% (fifth row of the ‘Current parameters’ column). Managers may experiment with the setting of different targets for a particular SKU. In the example given above, these experiments are shown as three scenarios (target service levels of 93%, 97%, and 99.5%). The bar chart shows the effect of varying the target, with respect to the average cycle stocks (to cover expected demand) and safety stocks (to allow for uncertainty of demand). This enables managers to make more informed judgements as to the most appropriate service level for a specific SKU.

Figure 3.3 RightStock Inventory Strategist.
Source: Teunter et al. (2017), Figure 1.
In conclusion, we can use the ‘what if’ facilities of software packages to experiment with different target service levels, at the level of an individual SKU. This experimentation will show the predicted effect of different targets on inventory levels and, hence, on inventory investment. It is then a matter for managers to make a judgement about the most appropriate target, taking into account the investments that would be required.
Читать дальшеИнтервал:
Закладка:
Похожие книги на «Intermittent Demand Forecasting»
Представляем Вашему вниманию похожие книги на «Intermittent Demand Forecasting» списком для выбора. Мы отобрали схожую по названию и смыслу литературу в надежде предоставить читателям больше вариантов отыскать новые, интересные, ещё непрочитанные произведения.


Обсуждение, отзывы о книге «Intermittent Demand Forecasting» и просто собственные мнения читателей. Оставьте ваши комментарии, напишите, что Вы думаете о произведении, его смысле или главных героях. Укажите что конкретно понравилось, а что нет, и почему Вы так считаете.