Raphael Kaplinsky - Sustainable Futures
Здесь есть возможность читать онлайн «Raphael Kaplinsky - Sustainable Futures» — ознакомительный отрывок электронной книги совершенно бесплатно, а после прочтения отрывка купить полную версию. В некоторых случаях можно слушать аудио, скачать через торрент в формате fb2 и присутствует краткое содержание. Жанр: unrecognised, на английском языке. Описание произведения, (предисловие) а так же отзывы посетителей доступны на портале библиотеки ЛибКат.

- Название:Sustainable Futures
- Автор:
- Жанр:
- Год:неизвестен
- ISBN:нет данных
- Рейтинг книги:5 / 5. Голосов: 1
-
Избранное:Добавить в избранное
- Отзывы:
-
Ваша оценка:
Sustainable Futures: краткое содержание, описание и аннотация
Предлагаем к чтению аннотацию, описание, краткое содержание или предисловие (зависит от того, что написал сам автор книги «Sustainable Futures»). Если вы не нашли необходимую информацию о книге — напишите в комментариях, мы постараемся отыскать её.
While this conclusion can lead to despair, in this broad-ranging book Raphael Kaplinsky, a leading development policy analyst, argues that the future is not necessarily bleak. Interrogating the causes and nature of the systemic crises we are living through, he shows how the challenges which we now face mirror previous historical epochs, in which dominant ‘techno-economic’ paradigms flourish, mature and run into crisis. In each case, decisive action is required to move to a more economically and socially sustainable world. In our time, we are witnessing the exhaustion of the Mass Production paradigm. How we herald and manage the transition to the next paradigm – that of Information and Communications Technologies – will determine our capacity to build a more prosperous, equitable and environmentally sustainable world. This book sets out an integrated agenda for action by multiple stakeholders to achieve this end.
Sustainable Futures — читать онлайн ознакомительный отрывок
Ниже представлен текст книги, разбитый по страницам. Система сохранения места последней прочитанной страницы, позволяет с удобством читать онлайн бесплатно книгу «Sustainable Futures», без необходимости каждый раз заново искать на чём Вы остановились. Поставьте закладку, и сможете в любой момент перейти на страницу, на которой закончили чтение.
Интервал:
Закладка:
2.2 What Accounts for the Fall in the Rate of Economic Growth?
Broadly speaking, economic growth arises from four sets of factors. The first is more and increasingly skilled labour; the second is more physical investment (‘capital’); the third is increased productivity as a result of improvements in equipment and in the organization of production; and the fourth is improvements in the infrastructure supporting the use of these inputs. I will predominantly focus on the first three of these growth-drivers in this chapter, but will revisit the role played by infrastructure in post-war growth in Chapter 5.
Was it a consequence of a shortage of labour?
The shortage of labour contributed little to the declining rate of economic growth after the early 1970s. There were, of course, skills shortages in particular sectors and economies. But, in general, the quantity of labour available to support investment remained in relatively abundant supply. When labour shortages did occur in the high-income industrial countries during the post-war boom, labour was imported from the developing world. For example, the UK actively encouraged both unskilled workers and skilled migrants from the Caribbean and South Asia during the 1950s and 1960s. In Western and Northern Europe, millions of migrants were drawn from North Africa and Turkey, and after the turn of the millennium both skilled and unskilled labour were sourced from Central and Eastern Europe. Further, access to labour in the high-income economies was not limited to migration. At the world level, labour was in abundant supply. The deepening of globalization after the mid-1980s took advantage of this global labour force and outsourced millions of jobs in manufacturing and services, from the high-income economies to China and other low- and middle-income economies. This enabled the corporate sector to draw on a vast global pool of cheap unskilled, and increasingly also semi-skilled, workers.
What about the contribution of investment to the growth slowdown?
In contrast to the availability of labour, the amount of new capital investment and its productivity were critically important in explaining this declining growth performance. Since 1970 (unfortunately, consistent data is not available to consider investment trends before that date), there has been a steady fall in the share of investment in all of the major high-income economies (measured as the share of new investment in Gross Domestic Product, GDP – Figure 2.2). This was particularly the case for the US. However, similar trends can be observed across the board in the major economies, especially Italy and the UK.
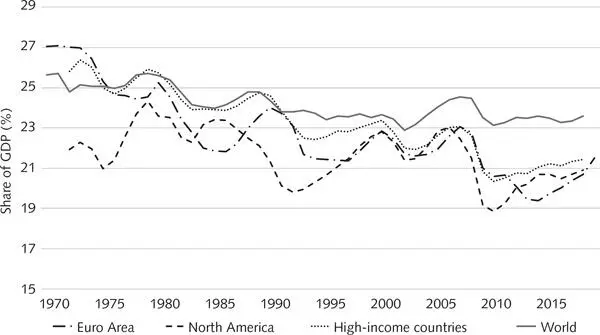
Figure 2.2 Share of investment in equipment and other physical assets (Gross Capital Formation) in GDP
Source : data from World Bank World Development Indicators
At the world level, considering the average of all economies irrespective of size, the share of new investment in GDP fell between 1970 and 1990, and stabilized thereafter. It is worth noting that much investment takes the form of replacing worn-out ‘depreciated’ productive capacity, buildings and infrastructure. In general, it is only when investment exceeds 15–16 per cent of GDP that it can be said that investment provides for additional productive capacity. As can be seen from Figure 2.2, the investment rate in the US and the Euro area after the 2008 Financial Crisis was perilously close to this depreciation rate.
As in the case of declining growth trends ( Figure 2.1), China has been a very significant outlier to this pattern of global slowdown in investment. Not only has the share of investment in its GDP been on a rising trend since 1970, but the size of this share is significantly higher than that for the major global economies and for the world economy as a whole. Compare China and the USA, for example. The investment-share in the US fell from its high point of 24 per cent between 1978 and 1980 to less than 20 per cent after 2010. In China, this share was more than 40 per cent throughout the 1990s and after the millennium, and reached 46 per cent in 2013. That means that China was devoting almost half of its total annual production to new capital investment.
And what about the productivity of investment?
The quantity of investment does not necessarily translate into increased output: it all depends on the quality – that is the productivity – of investment. There is a widespread belief that productivity was enhanced by the diffusion of computing across a range of industries after the invention of the microprocessor in 1971. Surely, it was argued, the availability of equipment capable of speeding up data-processing, providing greater accuracy in production and communicating with similar electronically controlled equipment would facilitate the substitution of machines for human endeavour – in other words, speed up labour productivity growth? And surely, electronically controlled machinery would be more productive than mechanically controlled equipment? Surprisingly, the evidence does not support this assertion. This led the Nobel Prize-winner Robert Solow to remark in 1987 that ‘You can see the computer age everywhere but in the productivity statistics.’
As can be seen from Figure 2.3, with the exception of a productivity-growth decade in the US after 1997, resulting from the initial deployment of ICTs, all of the major economies witnessed a declining trend in their growth of productivity (in this case, labour productivity) after World War 2. This fall in the rate of productivity growth was accentuated after the 2008 Financial Crisis. The productivity growth rates in the most recent decade (1 per cent, 0.9 per cent, 0.9 per cent, 0.6 per cent, 0.4 per cent and – 0.4 per cent for the US, Japan, Germany, France, UK and Italy, respectively) were significantly below those for the whole period between 1951 and 2017 (1.9 per cent, 4.1 per cent, 3.4 per cent, 3.1 per cent, 2.3 per cent and 2.6 per cent, respectively).
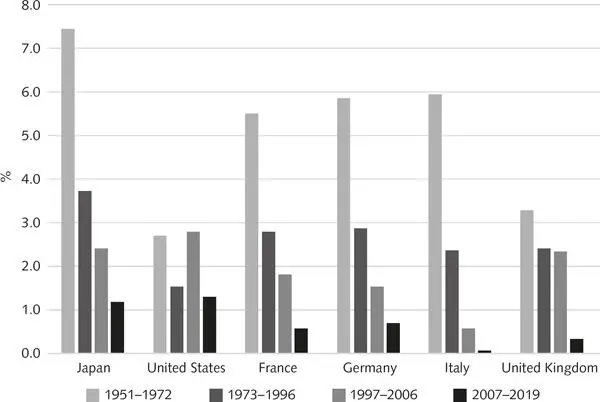
Figure 2.3 Annual growth of labour productivity, 1951–2019
Source : data from The Conference Board ( www.conference-board.org)
2.3 Neo-liberalism and the Decline in Growth, Investment and Productivity
Two factors explain the decline in the rates of productivity growth, economic growth and investment. As I have already observed, the first is that these outcomes result from the atrophy of the Mass Production paradigm which entered its maturity phase in the mid-1970s, and I will discuss this critical development in detail in Chapter 5. The second determinant of the slowdown, which I will discuss in the remainder of this chapter, was the neo-liberal policy response to the underlying slowdown in the growth trajectory of Mass Production. Neo-liberalism not only exacerbated the underlying problems of Mass Production, but also increasingly fuelled systemic inequality, the precarity of livelihoods and the fragility of economic systems. All of these, as we will see in the following chapter, contributed to the erosion of liberal democracies and the rise of populist politics, further undermining the sustainability of future economic growth.
Free trade and the retreat from Industrial Policy – increasing imbalances between countries
The post-war Golden Age growth boom between 1950 and the early 1970s was accompanied by a steady reduction in impediments to trade across national borders. Tariffs on imports and ‘non-tariff barriers’ (affecting the quantity of traded goods rather than their price) were steadily reduced in most of the high-income economies. After the mid-1970s and until the second decade of the twenty-first century, the pace of trade liberalization intensified. It also spread throughout the global economy to low- and middle-income economies, as well as to the formerly heavily protected communist countries in Eastern Europe. Even China, which continued to maintain many formal and informal restrictions on imports, opened many of its markets to imports.
Читать дальшеИнтервал:
Закладка:
Похожие книги на «Sustainable Futures»
Представляем Вашему вниманию похожие книги на «Sustainable Futures» списком для выбора. Мы отобрали схожую по названию и смыслу литературу в надежде предоставить читателям больше вариантов отыскать новые, интересные, ещё непрочитанные произведения.


Обсуждение, отзывы о книге «Sustainable Futures» и просто собственные мнения читателей. Оставьте ваши комментарии, напишите, что Вы думаете о произведении, его смысле или главных героях. Укажите что конкретно понравилось, а что нет, и почему Вы так считаете.