Raphael Kaplinsky - Sustainable Futures
Здесь есть возможность читать онлайн «Raphael Kaplinsky - Sustainable Futures» — ознакомительный отрывок электронной книги совершенно бесплатно, а после прочтения отрывка купить полную версию. В некоторых случаях можно слушать аудио, скачать через торрент в формате fb2 и присутствует краткое содержание. Жанр: unrecognised, на английском языке. Описание произведения, (предисловие) а так же отзывы посетителей доступны на портале библиотеки ЛибКат.
- Название:Sustainable Futures
- Автор:
- Жанр:
- Год:неизвестен
- ISBN:нет данных
- Рейтинг книги:5 / 5. Голосов: 1
-
Избранное:Добавить в избранное
- Отзывы:
-
Ваша оценка:
Sustainable Futures: краткое содержание, описание и аннотация
Предлагаем к чтению аннотацию, описание, краткое содержание или предисловие (зависит от того, что написал сам автор книги «Sustainable Futures»). Если вы не нашли необходимую информацию о книге — напишите в комментариях, мы постараемся отыскать её.
While this conclusion can lead to despair, in this broad-ranging book Raphael Kaplinsky, a leading development policy analyst, argues that the future is not necessarily bleak. Interrogating the causes and nature of the systemic crises we are living through, he shows how the challenges which we now face mirror previous historical epochs, in which dominant ‘techno-economic’ paradigms flourish, mature and run into crisis. In each case, decisive action is required to move to a more economically and socially sustainable world. In our time, we are witnessing the exhaustion of the Mass Production paradigm. How we herald and manage the transition to the next paradigm – that of Information and Communications Technologies – will determine our capacity to build a more prosperous, equitable and environmentally sustainable world. This book sets out an integrated agenda for action by multiple stakeholders to achieve this end.
Sustainable Futures — читать онлайн ознакомительный отрывок
Ниже представлен текст книги, разбитый по страницам. Система сохранения места последней прочитанной страницы, позволяет с удобством читать онлайн бесплатно книгу «Sustainable Futures», без необходимости каждый раз заново искать на чём Вы остановились. Поставьте закладку, и сможете в любой момент перейти на страницу, на которой закончили чтение.
Интервал:
Закладка:
Governments and citizenry alike ponder how the economy will recover after the pandemic? Will it be a V-shaped recovery – rapid growth following rapid decline? Or might the recovery be W-shaped – rapid growth, followed by a second collapse, and then recovery? Perhaps a U-shape – rapid decline and a period of prolonged stagnation before revival? How about a K-shaped recovery – with the rich getting richer and the poor getting poorer? Each of these scenarios assumes that a recovery is inevitable, that the shape of global economic growth will not take the form of the ‘dreaded L’ – a sharp decline and no recovery. Underlying most of this speculative frenzy is the belief that it was Covid-19 that disrupted ‘normality’. As if what existed before the pandemic was sustainable. As if the Great Recession which followed the Financial Crisis of 2008 was a temporary blip which could be managed with a modicum of tinkering to economic policy.
This optimism about the prospects for renewed future economic growth – a return to ‘normality’ – is misguided. The global economy witnessed historically unprecedented rates of economic growth after the Great Acceleration in 1950. But this growth surge began to taper off after the mid-1970s. The fundamentals had turned. Deep structural flaws which undermined sustained economic growth had begun to emerge. Their impact was delayed by the expansion of globalization from the mid-1980s. But the relief was temporary. The structural weaknesses in the Mass Production growth paradigm poked their heads above the surface in the burst high-tech bubble in 1998–9. After a brief respite, they then re-emerged frontally in the global Financial Crisis in 2008 which resulted in the greatest economic decline since the 1930s. Again, the impact of these structural problems was temporarily masked, with the reflationary economic policies failing to address underlying structural problems, particularly with regard to the size and character of the financial system.
This is the story which is described in this chapter. In documenting this growing spectre of economic unsustainability, I will begin by reviewing the rise and then the slowdown in the rate of economic growth after World War 2. I will show how this slowdown resulted from a decline in investment- and productivity-growth. Two sets of related factors explain this fall in the underlying drivers of growth. The first was the exhaustion of the productivity gains delivered by the Mass Production techno-economic paradigm. I will discuss this phenomenon in Chapter 5. The second – the subject matter of this chapter – was the economic policies adopted after the triumph of neo-liberalism in the early 1980s. These not only resulted in an increasingly unequal society but also decisively shifted the political economy of growth in favour of the financial sector and (as I will show in the next chapter) the interests of the plutocracy. The post-1980s neo-liberal era was characterized by a decline in investment in long-term innovation and growth, intensifying financial speculation, deindustrialization, rising debt, increasing economic volatility and the adoption of austerity economic policies. The chapter concludes by highlighting a number of developments intrinsic to the evolution of the Mass Production economy which threaten the sustainability of the global economy. These developments made sustainable economic growth unlikely, even before the economic collapse resulting from the Covid-19 pandemic.
2.1 The Rise and Fall of Economic Growth, 1950–2018
The dawn of the new decade in 1950 followed twenty years of global turmoil, particularly in Europe and North America. The 1930s had been dominated by the Great Depression, with falling living standards and millions of people thrown out of work. The decade saw the rise of Nazism in Germany, and fascism in many other European countries. If the Depression was not bad enough, 20 million soldiers and 40 million civilians were killed during World War 2. Much of the productive capacity of European economies was destroyed, and Europe’s infrastructure was in tatters.
It was on these shaky foundations that the world transitioned to two decades of unparalleled rapid economic expansion after World War 2, and not just in the high-income industrialized economies. Economic historians characterize this era as the ‘Golden Age’. This economic expansion was based on a reconstruction boom, with very large investments going into repairing the damages of war, massive house-building programmes and creating the infrastructure for a new age of mass consumption, automobilization and suburbanization. This sustained economic progress was made possible by the productivity gains generated by the deployment of the Mass Production techno-economic paradigm.
However, the benefits of these stimulants to growth began to tail off. After the early 1970s, the global economic growth rate and the rate of growth in the two major economic regions (the USA and Europe) declined steadily. Figure 2.1provides a pictorial snapshot of these post-war growth trends for the world, for the US and for those economies currently members of the European Union. The data reflect the simple average of individual economies’ growth rates, and take no account of the relative size of their economies. Eyeballing this graphical representation, three trends are clear. First, there was considerable variation between years. Second, the average growth rates of the world, the US and Europe broadly followed similar trends. Third, after 1973 the trend rates of growth declined. Given population growth this means that in recent years – on average and not taking account of the distribution of growth – there was barely any increase in per capita incomes. (In fact, as I will show in the following chapter, most of the gains from growth were reaped by the already rich. In the US, for example, real wages for the low- and middle-skilled workforce stagnated after 1979.)
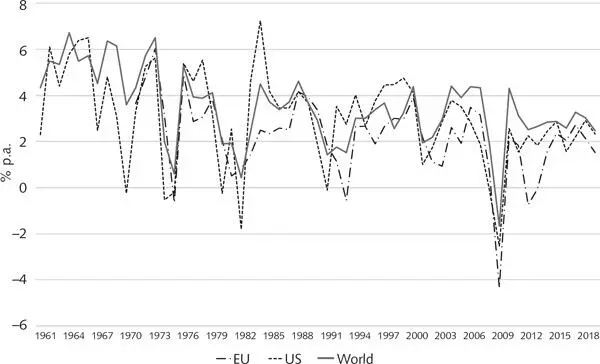
Figure 2.1 The expansion of Gross Domestic Product, 1961–2018: World, US and Europe (% per annum)
Source : data from World Bank World Development Indicators
Table 2.1decomposes these broad trends into four periods. The first reflects the high-growth phase between 1961 and 1973, the Golden Age. (In fact, the boom began during the 1950s, but a consistent database is unavailable to illustrate this.) The second period – 1974 to 1985 – was dominated by the recovery from the two oil-price shocks of 1973 and 1979. The third phase (1986–2006) was one of deepening globalization, coinciding with China’s policy of ‘Opening Out’ in 1985. This led to the unbundling of production in the high-income economies and the growth of global supply chains in China and other low-wage economies. The final period was the decade after the 2008 Financial Crisis.
Table 2.1 Average annual economic growth rates: World, US and Europe (%)
| 1961–1973 | 1974–1985 | 1986–2006 | 2007–2017 | |
|---|---|---|---|---|
| World | 5.5 | 3.2 | 3.0 | 2.6 |
| United States | 4.6 | 3.1 | 3.0 | 1.4 |
| European Union | 5.0 | 2.3 | 2.4 | 1.0 |
| China | 5.2 | 8.9 | 9.4 | 8.8 |
| India | 3.5 | 4.9 | 5.6 | 6.9 |
| Source : data from World Bank World Development Indicators |
These data evidence a steady decline in economic growth rates in the US and European economies which dominated the global economy. During the Golden Age first phase, their average annual growth rates exceeded 4.5 per cent. Thereafter, they declined steadily to an annual average of around 3 per cent until 2006. After the Financial Crisis in 2008, the rate of economic growth in both the US and Europe did not even match the rate of population growth. By contrast, some developing countries, including very large economies such as China and India, experienced sustained and high rates of growth over this long time period, exceeding 8 per cent in China and 5 per cent in India for more than two decades.
Читать дальшеИнтервал:
Закладка:
Похожие книги на «Sustainable Futures»
Представляем Вашему вниманию похожие книги на «Sustainable Futures» списком для выбора. Мы отобрали схожую по названию и смыслу литературу в надежде предоставить читателям больше вариантов отыскать новые, интересные, ещё непрочитанные произведения.


Обсуждение, отзывы о книге «Sustainable Futures» и просто собственные мнения читателей. Оставьте ваши комментарии, напишите, что Вы думаете о произведении, его смысле или главных героях. Укажите что конкретно понравилось, а что нет, и почему Вы так считаете.