Ernest P. Chan - Quantitative Trading
Здесь есть возможность читать онлайн «Ernest P. Chan - Quantitative Trading» — ознакомительный отрывок электронной книги совершенно бесплатно, а после прочтения отрывка купить полную версию. В некоторых случаях можно слушать аудио, скачать через торрент в формате fb2 и присутствует краткое содержание. Жанр: unrecognised, на английском языке. Описание произведения, (предисловие) а так же отзывы посетителей доступны на портале библиотеки ЛибКат.
- Название:Quantitative Trading
- Автор:
- Жанр:
- Год:неизвестен
- ISBN:нет данных
- Рейтинг книги:5 / 5. Голосов: 1
-
Избранное:Добавить в избранное
- Отзывы:
-
Ваша оценка:
Quantitative Trading: краткое содержание, описание и аннотация
Предлагаем к чтению аннотацию, описание, краткое содержание или предисловие (зависит от того, что написал сам автор книги «Quantitative Trading»). Если вы не нашли необходимую информацию о книге — напишите в комментариях, мы постараемся отыскать её.
, quant trading expert Dr. Ernest P. Chan shows you how to apply both time-tested and novel quantitative trading strategies to develop or improve your own trading firm.
You'll discover new case studies and updated information on the application of cutting-edge machine learning investment techniques, as well as:
Updated back tests on a variety of trading strategies, with included Python and R code examples A new technique on optimizing parameters with changing market regimes using machine learning. A guide to selecting the best traders and advisors to manage your money Perfect for independent retail traders seeking to start their own quantitative trading business, or investors looking to invest in such traders, this new edition of
will also earn a place in the libraries of individual investors interested in exploring a career at a major financial institution.
Quantitative Trading — читать онлайн ознакомительный отрывок
Ниже представлен текст книги, разбитый по страницам. Система сохранения места последней прочитанной страницы, позволяет с удобством читать онлайн бесплатно книгу «Quantitative Trading», без необходимости каждый раз заново искать на чём Вы остановились. Поставьте закладку, и сможете в любой момент перейти на страницу, на которой закончили чтение.
Интервал:
Закладка:
Your Goal
Most people who choose to become traders want to earn a steady (hopefully increasing) monthly, or at least quarterly, income. But you may be independently wealthy, and long-term capital gain is all that matters to you. The strategies to pursue for short-term income versus long-term capital gain are distinguished mainly by their holding periods. Obviously, if you hold a stock for an average of one year, you won't be generating much monthly income (unless you started trading a while ago and have launched a new subportfolio every month, which you proceed to hold for a year—that is, you stagger your portfolios.) More subtly, even if your strategy holds a stock only for a month on average, your month-to-month profit fluctuation is likely to be fairly large (unless you hold hundreds of different stocks in your portfolio, which can be a result of staggering your portfolios), and therefore you cannot count on generating income on a monthly basis. This relationship between holding period (or, conversely, the trading frequency) and consistency of returns (that is, the Sharpe ratio or, conversely, the drawdown) will be discussed further in the following section. The upshot here is that the more regularly you want to realize profits and generate income, the shorter your holding period should be.
There is a misconception aired by some investment advisers, though, that if your goal is to achieve maximum long-term capital growth, then the best strategy is a buy-and-hold one. This notion has been shown to be mathematically false. In reality, maximum long-term growth is achieved by finding a strategy with the maximum Sharpe ratio (defined in the next section), provided that you have access to sufficiently high leverage . Therefore, comparing a short-term strategy with a very short holding period, small annual return, but very high Sharpe ratio, to a long-term strategy with a long holding period, high annual return, but lower Sharpe ratio, it is still preferable to choose the short-term strategy even if your goal is long-term growth, barring tax considerations and the limitation on your margin borrowing (more on this surprising fact later in Chapter 6on money and risk management).
A TASTE FOR PLAUSIBLE STRATEGIES AND THEIR PITFALLS
Now, let's suppose that you have read about several potential strategies that fit your personal requirements. Presumably, someone else has done backtests on these strategies and reported that they have great historical returns. Before proceeding to devote your time to performing a comprehensive backtest on this strategy (not to mention devoting your capital to actually trading this strategy), there are a number of quick checks you can do to make sure you won't be wasting your time or money.
How Does It Compare with a Benchmark, and How Consistent Are Its Returns?
This point seems obvious when the strategy in question is a stock-trading strategy that buys (but not shorts) stocks. Everybody seems to know that if a long-only strategy returns 10 percent a year, it is not too fantastic because investing in an index fund will generate as good, if not better, returns on average. However, if the strategy is a long–short dollar-neutral strategy (i.e., the portfolio holds long and short positions with equal capital), then 10 percent is quite a good return, because then the benchmark of comparison is not the market index, but a riskless asset such as the yield of the three-month US Treasury bill (which at the time of this writing is just about zero percent).
Another issue to consider is the consistency of the returns generated by a strategy. Though a strategy may have the same average return as the benchmark, perhaps it delivered positive returns every month while the benchmark occasionally suffered some very bad months. In this case, we would still deem the strategy superior. This leads us to consider the information ratio or Sharpe ratio (Sharpe, 1994), rather than returns, as the proper performance measurement of a quantitative trading strategy.
Information ratio is the measure to use when you want to assess a long-only strategy. It is defined as
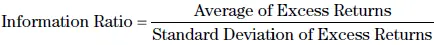
where

Now the benchmark is usually the market index to which the securities you are trading belong. For example, if you trade only small-cap stocks, the market index should be the Standard & Poor's small-cap index or the Russell 2000 index, rather than the S&P 500. If you are trading just gold futures, then the market index should be gold spot price, rather than a stock index.
The Sharpe ratio is actually a special case of the information ratio, suitable when we have a dollar-neutral strategy, so that the benchmark to use is always the risk-free rate. In practice, most traders use the Sharpe ratio even when they are trading a directional (long or short only) strategy, simply because it facilitates comparison across different strategies. Everyone agrees on what the risk-free rate is, but each trader can use a different market index to come up with their own favorite information ratio, rendering comparison difficult.
(Actually, there are some subtleties in calculating the Sharpe ratio related to whether and how to subtract the risk-free rate, how to annualize your Sharpe ratio for ease of comparison, and so on. I will cover these subtleties in the next chapter, which will also contain an example on how to compute the Sharpe ratio for a dollar-neutral and a long-only strategy.)
If the Sharpe ratio is such a nice performance measure across different strategies, you may wonder why it is not quoted more often instead of returns. In fact, when a colleague and I went to SAC Capital Advisors (assets under management then: $14 billion) to pitch a strategy, their then-head of risk management said to us: “Well, a high Sharpe ratio is certainly nice, but if you can get a higher return instead, we can all go buy bigger houses with our bonuses!” This reasoning is quite wrong: A higher Sharpe ratio will actually allow you to make more profits in the end, since it allows you to trade at a higher leverage. It is the leveraged return that matters in the end, not the nominal return of a trading strategy. For more on this, see Chapter 6on money and risk management.
(And no, our pitching to SAC was not successful, but for reasons quite unrelated to the returns of the strategy. In any case, at that time neither my colleague nor I were familiar enough with the mathematical connection between the Sharpe ratio and leveraged returns to make a proper counterargument to that head of risk management. SAC pleaded guilty to insider trading charges and ceased to be a hedge fund in 2013.)
Now that you know what a Sharpe ratio is, you may want to find out what kind of Sharpe ratio your candidate strategies have. Often, they are not reported by the authors of that strategy, and you will have to email them in private for this detail. And often, they will oblige, especially if the authors are finance professors; but if they refuse, you have no choice but to perform the backtest yourself. Sometimes, however, you can still make an educated guess based on the flimsiest of information:
If a strategy trades only a few times a year, chances are its Sharpe ratio won't be high. This does not prevent it from being part of your multistrategy trading business, but it does disqualify the strategy from being your main profit center.
If a strategy has deep (e.g., more than 10 percent) or lengthy (e.g., four or more months) drawdowns, it is unlikely that it will have a high Sharpe ratio. I will explain the concept of drawdown in the next section, but you can just visually inspect the equity curve (which is also the cumulative profit-and-loss curve, assuming no redemption or cash infusion) to see if it is very bumpy. Any peak-to-trough of that curve is a drawdown. (See Figure 2.1for an example.)
Читать дальшеИнтервал:
Закладка:
Похожие книги на «Quantitative Trading»
Представляем Вашему вниманию похожие книги на «Quantitative Trading» списком для выбора. Мы отобрали схожую по названию и смыслу литературу в надежде предоставить читателям больше вариантов отыскать новые, интересные, ещё непрочитанные произведения.


Обсуждение, отзывы о книге «Quantitative Trading» и просто собственные мнения читателей. Оставьте ваши комментарии, напишите, что Вы думаете о произведении, его смысле или главных героях. Укажите что конкретно понравилось, а что нет, и почему Вы так считаете.