Robin Spence - Why do buildings collapse in earthquakes? Building for safety in seismic areas
Здесь есть возможность читать онлайн «Robin Spence - Why do buildings collapse in earthquakes? Building for safety in seismic areas» — ознакомительный отрывок электронной книги совершенно бесплатно, а после прочтения отрывка купить полную версию. В некоторых случаях можно слушать аудио, скачать через торрент в формате fb2 и присутствует краткое содержание. Жанр: unrecognised, на английском языке. Описание произведения, (предисловие) а так же отзывы посетителей доступны на портале библиотеки ЛибКат.
- Название:Why do buildings collapse in earthquakes? Building for safety in seismic areas
- Автор:
- Жанр:
- Год:неизвестен
- ISBN:нет данных
- Рейтинг книги:3 / 5. Голосов: 1
-
Избранное:Добавить в избранное
- Отзывы:
-
Ваша оценка:
Why do buildings collapse in earthquakes? Building for safety in seismic areas: краткое содержание, описание и аннотация
Предлагаем к чтению аннотацию, описание, краткое содержание или предисловие (зависит от того, что написал сам автор книги «Why do buildings collapse in earthquakes? Building for safety in seismic areas»). Если вы не нашли необходимую информацию о книге — напишите в комментариях, мы постараемся отыскать её.
Readers will benefit from the inclusion of:
A thorough introduction to how buildings have behaved in earthquakes, including a description of the world’s most lethal earthquakes and the fatality trend over time An exploration of how buildings are constructed around the world, including considerations of the impact of climate and seismicity on home design A discussion of what happens during an earthquake, including the types and levels of ground motion, landslides, tsunamis, and sequential effects, and how different types of buildings tend to behave in response to those phenomena What different stakeholders can do to improve the earthquake safety of their buildings The owners and managers of buildings in earthquake zones and those responsible for the safety of people who occupy or visit them will find
essential reading, as will all architects, designers and engineers who design or refurbish buildings in earthquake zones.
Why do buildings collapse in earthquakes? Building for safety in seismic areas — читать онлайн ознакомительный отрывок
Ниже представлен текст книги, разбитый по страницам. Система сохранения места последней прочитанной страницы, позволяет с удобством читать онлайн бесплатно книгу «Why do buildings collapse in earthquakes? Building for safety in seismic areas», без необходимости каждый раз заново искать на чём Вы остановились. Поставьте закладку, и сможете в любой момент перейти на страницу, на которой закончили чтение.
Интервал:
Закладка:
More detailed accounts of the performance of buildings are given in the EEFIT and EERI reports referenced in relation to each event. In addition, these reports contain detailed information on the performance of geotechnical structures, of building foundations and of infrastructure, particularly roads and bridges, dams and ports. They also contain some recommendations for reconstruction and for future building. The earthquake performance of buildings of different forms of construction is discussed in more detail in Chapter 5, and ways in which buildings can be improved are discussed in Chapter 7.
2.4 Earthquake Losses in Rich and Poor Countries
Table 2.1lists 23 significant earthquakes which have occurred since the year 2000, causing a total of 699 000 deaths and US$488bn of damage costs. Using data on national income given by the World Bank, we can allocate these totals by the four country income categories defined by the World Bank, as shown in Table 2.2.
Table 2.2Distribution by World Bank Income Groups of deaths and damage costs in the 23 significant earthquakes listed in Table 2.1.
Source: World Bank (2019).
| World Bank Country Group | GNI/capita (2018 US$) | Deaths (% of total) | Damage costs (% of total) |
|---|---|---|---|
| Low‐income | <996 | 33 | 3 |
| Lower‐middle income | 996–3 895 | 13 | 2 |
| Upper‐middle income | 3 896–12 055 | 51 | 25 |
| High‐income | >12 055 | 3 | 71 |
The income group of each country is shown in Table 2.1(World Bank 2019).
Of the deaths, 51% have occurred in upper‐middle income countries, 13% in lower‐middle income countries, 33% in low‐income countries and only 3% in high‐income countries (principally the 2011 tsunami deaths in Japan). For damage costs, the order is reversed: 71% of the damage costs were borne by the high‐income countries (mostly by Japan), a further 25% by the upper‐middle income countries and only 2 and 3%, respectively, in the lower‐middle and low income countries. So clearly, a country's vulnerability depends to an extent on its relative wealth. But most of the deaths from these events were in the upper‐middle income countries, not the poorest. And damage costs were very significantly concentrated in the high‐income countries.
Another way to look at this disparity is to plot damage costs against casualty figures country by country, using all of the earthquakes which are reported for each country in the EM‐DAT database for the period 2000–2019 (CRED 2020). This plot is shown in Figure 2.19.
Dotted lines on the chart show the loss per fatality from the earthquakes during this 20‐year period. The position of different countries on this chart shows both their relative earthquake‐proneness and their relative wealth. Countries with the highest life loss are on the right of the chart, but those with the greatest damage cost at the top. The most vulnerable countries are those towards the bottom right (India, Pakistan, Nepal, Iran, Indonesia and Haiti). The least vulnerable to loss of life are at the top left (Chile, Italy and Mexico). Countries such as the United States and Greece in which fewer than 200 lives were lost in that period of time as a result of earthquake ground shaking do not appear on the chart at all.
2.5 Are Earthquake Losses Decreasing Over Time?
In order to investigate whether earthquake losses are decreasing over time, we need to look at both human casualties and damage costs. Both need to be viewed from a longer‐term perspective than just the 20 years which has been the focus of this chapter so far. Because most of the damage and casualties occur in just a few earthquakes, it is better to assemble the loss data by decade.
Reasonably reliable data on human casualties are available from about 1900 onwards, using a variety of catalogues, and this has been assembled and maintained by our colleague Antonios Pomonis (Daniell et al. 2018). The chart shown in Figure 2.20is based on these data. Because the world's population has been growing rapidly in this period, it is important to take account of this increase in comparing the number of deaths over time. Figure 2.20shows the earthquake mortality rate in each decade since 1900, where the mortality rate is the estimated number of deaths per 100 000 of the world's population in the mid‐year of the decade. Data on serious injuries are also available for many events, but injury definitions vary, so these are less useful for long‐term comparisons.
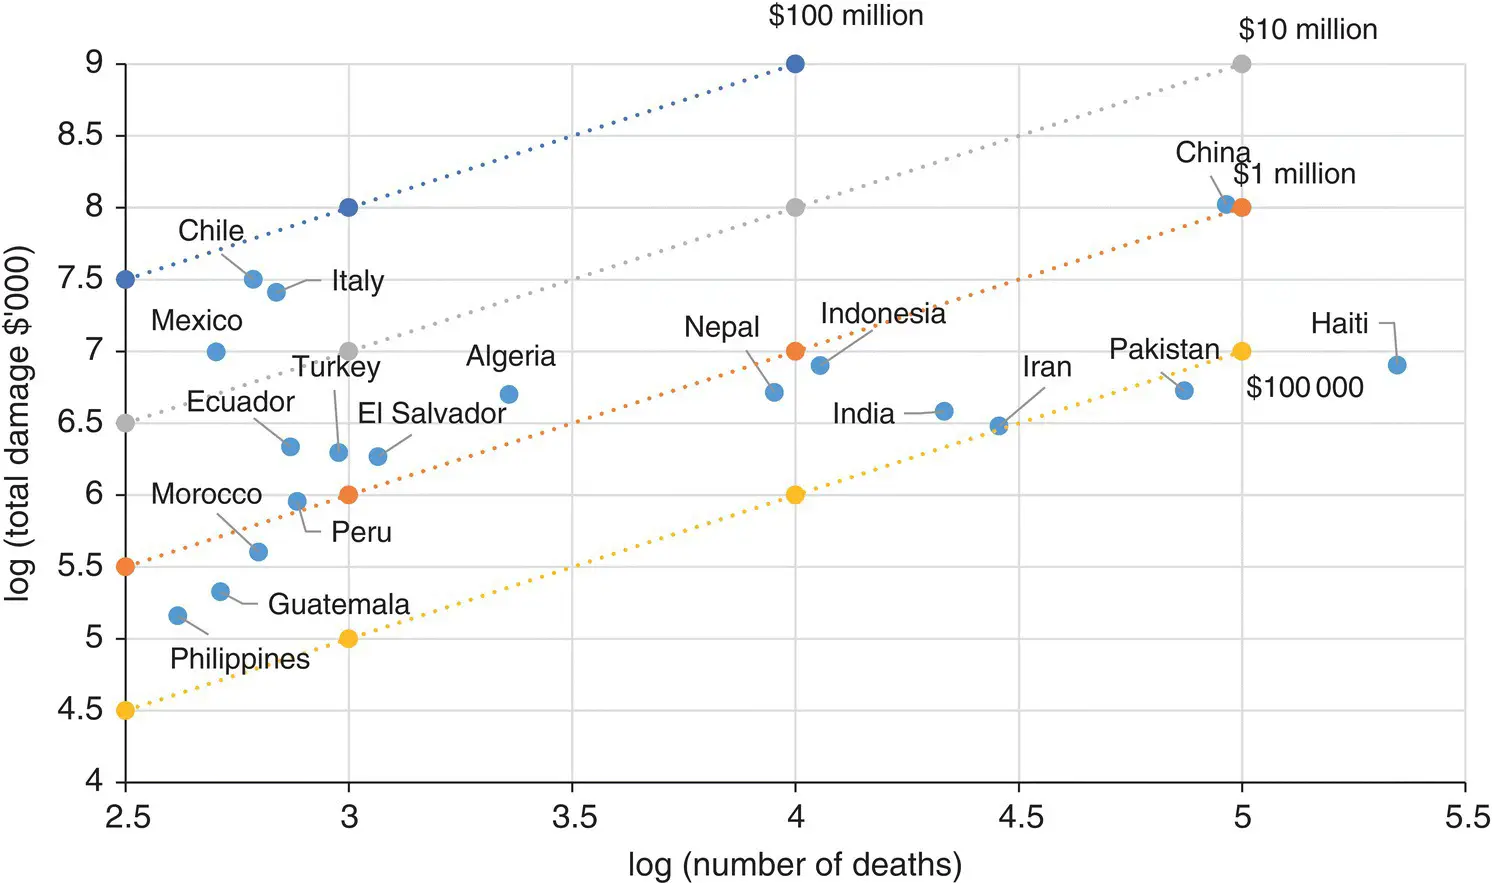
Figure 2.19Earthquake damage and fatalities by country 2000–2019, using a logarithmic scale based on EM‐DAT Disasters Database (CRED 2020). Note: this chart excludes events in which the majority of deaths were related to tsunami rather than ground shaking.
Source: Data from CRED (2020).
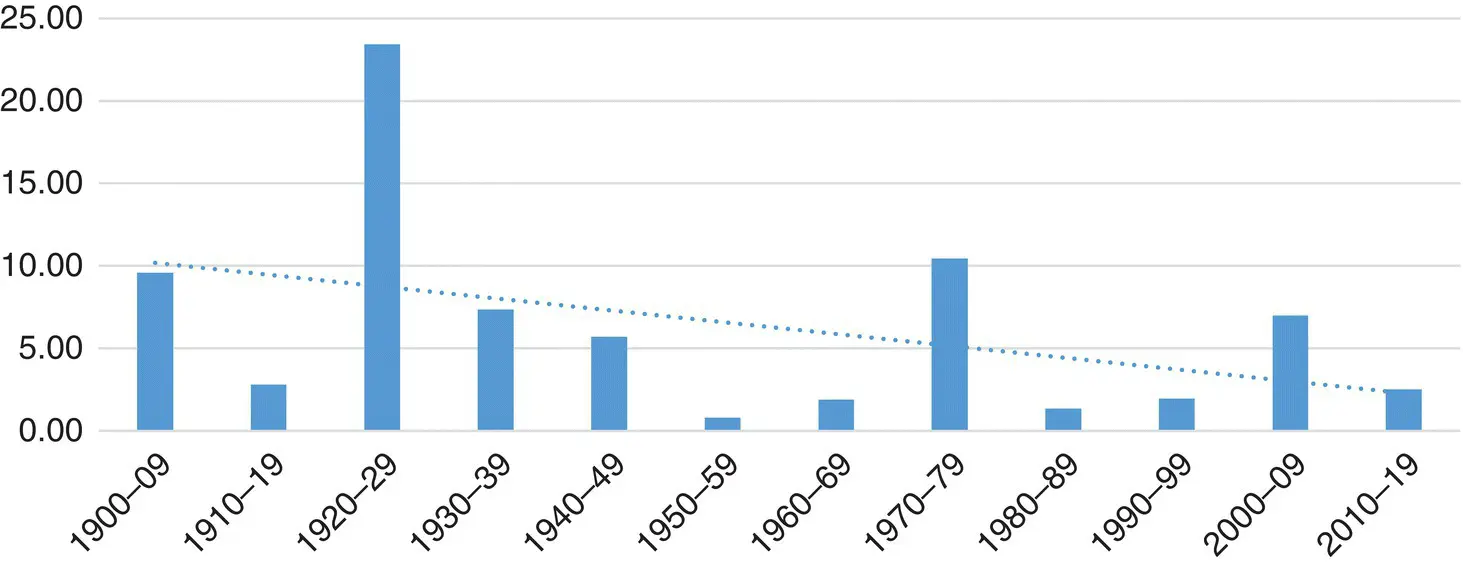
Figure 2.20Global earthquake mortality rate since 1900 (deaths per 100 000 population).
Source: Data from Antonios Pomonis's Fatal Earthquakes database.
Figure 2.20shows that the mortality rate has been decreasing to some extent over the last 120 years, as indicated by the trendline. But the decline is slow and actual mortality rates vary enormously from decade to decade.
There are some reasons for thinking that this positive downward trend will continue. Fire following earthquakes is a smaller risk than it was, because of changes in building materials and fire protection. And there is also evidence that in many countries, there is increasing adherence to building codes partly as a result of greater public awareness of the earthquake risk. And specific building strengthening programmes have been undertaken in some countries (see Chapter 8). On the other hand, as Roger Musson has noted in his book The Million Death Quake (Musson 2012), the continuing concentration of global population into huge cities with extremely vulnerable housing is increasing the risks in many of them, and has given rise to the possibility of a single future earthquake which could cause more than a million deaths, a much higher death toll than has occurred to date in a single event. The most at‐risk cities can now be identified, and efforts are being made in many of them to improve construction standards. Future trends in the mortality rate will depend crucially on what can and is being achieved in these cities. A further factor which could influence future death rates is the rapid increase of population in coastal areas (A. Pomonis, 2020, personal communication). Daniell et al. (2012) also points out that there has been, over the period 1900–2012, an increase in earthquake deaths as a percentage of total deaths, suggesting that greater success has been achieved in reducing death rates from other causes.
The costs of earthquake damage have also been assembled for over 7000 damaging earthquakes since 1900 in the CATDAT database by James Daniell and co‐workers at KIT in Karlsruhe in Germany, and the trends in losses up to 2012 have been analysed (Daniell et al. 2012). Costs of earthquakes are usually divided into direct and indirect costs. The direct costs are those associated with the actual damage caused by the earthquake, while the indirect costs (which are more difficult to quantify) are those associated with loss of production and overall economic consequences of the event. To compare the losses over time, costs have been brought to a present value. The adjustment is to bring all costs to the values that would be paid in today's money for the event‐year earthquake effects. The total (direct and estimated indirect) earthquake losses have then been calculated as a percentage of GWP, the Gross World Product (the world's total economic output), also adjusted to present‐day values, to give an annual global loss rate.
Читать дальшеИнтервал:
Закладка:
Похожие книги на «Why do buildings collapse in earthquakes? Building for safety in seismic areas»
Представляем Вашему вниманию похожие книги на «Why do buildings collapse in earthquakes? Building for safety in seismic areas» списком для выбора. Мы отобрали схожую по названию и смыслу литературу в надежде предоставить читателям больше вариантов отыскать новые, интересные, ещё непрочитанные произведения.


Обсуждение, отзывы о книге «Why do buildings collapse in earthquakes? Building for safety in seismic areas» и просто собственные мнения читателей. Оставьте ваши комментарии, напишите, что Вы думаете о произведении, его смысле или главных героях. Укажите что конкретно понравилось, а что нет, и почему Вы так считаете.