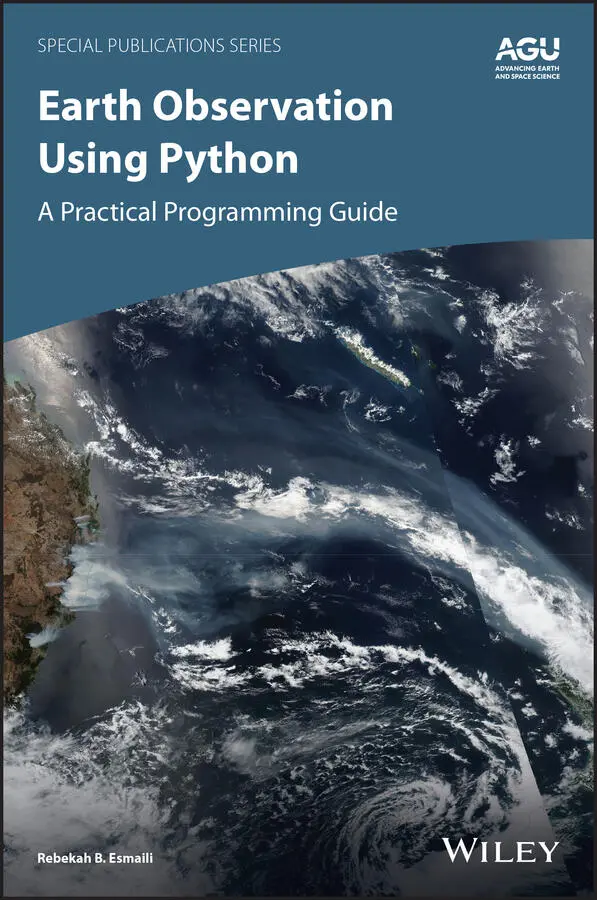
Rebekah B. Esmaili - Earth Observation Using Python
Здесь есть возможность читать онлайн «Rebekah B. Esmaili - Earth Observation Using Python» — ознакомительный отрывок электронной книги совершенно бесплатно, а после прочтения отрывка купить полную версию. В некоторых случаях можно слушать аудио, скачать через торрент в формате fb2 и присутствует краткое содержание. Жанр: unrecognised, на английском языке. Описание произведения, (предисловие) а так же отзывы посетителей доступны на портале библиотеки ЛибКат.
- Название:Earth Observation Using Python
- Автор:
- Жанр:
- Год:неизвестен
- ISBN:нет данных
- Рейтинг книги:5 / 5. Голосов: 1
-
Избранное:Добавить в избранное
- Отзывы:
-
Ваша оценка:
Earth Observation Using Python: краткое содержание, описание и аннотация
Предлагаем к чтению аннотацию, описание, краткое содержание или предисловие (зависит от того, что написал сам автор книги «Earth Observation Using Python»). Если вы не нашли необходимую информацию о книге — напишите в комментариях, мы постараемся отыскать её.
Earth Observation Using Python: A Practical Programming Guide Gain Python fluency using real data and case studies Read and write common scientific data formats, like netCDF, HDF, and GRIB2 Create 3-dimensional maps of dust, fire, vegetation indices and more Learn to adjust satellite imagery resolution, apply quality control, and handle big files Develop useful workflows and learn to share code using version control Acquire skills using online interactive code available for all examples in the book The American Geophysical Union promotes discovery in Earth and space science for the benefit of humanity. Its publications disseminate scientific knowledge and provide resources for researchers, students, and professionals.
Earth Observation Using Python — читать онлайн ознакомительный отрывок
Ниже представлен текст книги, разбитый по страницам. Система сохранения места последней прочитанной страницы, позволяет с удобством читать онлайн бесплатно книгу «Earth Observation Using Python», без необходимости каждый раз заново искать на чём Вы остановились. Поставьте закладку, и сможете в любой момент перейти на страницу, на которой закончили чтение.
Интервал:
Закладка:
2.2.2 Pandas
Pandasis a library that permits using data frame (stylized DataFrame) structures and includes a suite of I/O and data manipulation tools. Unlike NumPy, Pandas allows you to reference named columns instead of using indices. With Pandas, you can perform the same kinds of essential tasks that are available in spreadsheet programs (but now automated and with fewer mouse clicks!). For those who are familiar with R programming language, Pandas mimics the R data.frame function.
A limitation of Pandas is that it can only operate with 2D data structures. More recently, the xarraypackage has been developed to handle higher‐dimensional datasets. In addition, Pandas can be somewhat inefficient because the library is technically a wrapper for NumPy, so it can consume up to three times as much memory, particularly in Jupyter Notebook. For larger row operations (500K rows or greater), the differences can even out. (Goutham, 2017).
2.2.3 Matplotlib
Matplotlibis a plotting library, arguably the most popular one. Matplotlib can generate histograms, power spectra, bar charts, error charts, and scatterplots with a few lines of code. The plots can be completely customized to suit your aesthetics. Due to their similarities, this is another package where MATLAB experience may come in handy.
2.2.4 netCDF4 and h5py
I will discuss two common self‐describing data formats, netCDF and HDF, in Section 3.2.3. Two major packages for importing these formats are the netCDF4and h5pypackages. These tools are advantageous because the user does not have to have any knowledge of how to parse the input files, so long as the files follow standard formatting. These two packages import the data, which can then be converted to NumPy to perform more rigorous data operations.
2.2.5 Cartopy
Cartopyis a package for projecting geospatial data to maps. It can also be used to access a wealth of features, including land/ocean masks and topography. Many projections are available, and you can easily transform the data between them.
Previously, Basemapwas the primary package for creating maps. You may come across examples that use it online. However, the package is now deprecated and Cartopy has become the primary package that interfaces with Matplotlib.
Cartopy is a package available from the SciTools organization, which was originally developed by the UK Met Office. It has now expanded into a community collaboration.
2.3 Maturing Packages
The packages detailed in this section are worth mentioning because they may apply to your specific project. Further, some features are too good to ignore, so they are highlighted below. However, if your code requires a long‐term shelf life, it may be best to find alternative solutions, as the following packages may change more rapidly than those listed in Section 2.3.
2.3.1 xarray
xarrayis a package that borrows heavily from Pandas to organize multidimensional data. Mathematical operations are lightning fast thanks to dimensional and coordinate indexing. Visualization is also easy. xarray is valuable to Earth scientists because it permits opening multiple netCDF files with ease. Interpolation and group operations is also possible.
The xarray syntax can be challenging to newcomers. It can be difficult to wrangle the data into the format needed. Nevertheless, this tool is worth the time investment due to the many features of interest to Earth science.
2.3.2 Dask
Daskinterfaces with Pandas, Scikit‐Learn, and NumPy to perform parallel processing and out‐of‐memory operations that can read data in chunks without ever being totally in the computer’s RAM. This is very useful for working with large datasets. If speed needs to be prioritized, it would be worth learning this package.
2.3.3 Iris
Irisis a format‐agnostic Python library for analyzing and visualizing Earth science data. If datasets follow the standard CF formatting conventions, Iris can easily load the data. The Iris package has a steep learning curve but can be useful for performing meteorological computations. Like Cartopy, Iris is a package available from the SciTools organization.
2.3.4 MetPy
MetPyis a collection of tools in Python for reading, visualizing, and performing calculations with weather data. MetPy enables downloading a curated collection of remote sensing datasets. Unit conversions are easy to perform, which is helpful when making calculations of meteorological variables. MetPy is maintained by Unidata in Boulder, Colorado.
2.3.5 cfgrib and eccodes
Cfgribis a useful package for reading GRIB1 and GRIB2 data, which is a common format for reanalysis and model data, particularly for the ECMWF. Cfgrib decodes GRIB data in a way that it mimics the structure of NetCDF files using the ecCodespython package. ecCodes was developed by ECMWF to decoding and encoding standard WMO GRIB and BUFR files.
2.4 Summary
I hope you are excited to begin your Python journey. Since it is free and open‐source, Python is a valuable tool that you can carry with you for the rest of your career. Furthermore, there are many existing packages to perform common tasks in the Earth Sciences, such as importing common datasets, organizing data, performing mathematical analysis, and displaying results. In the next chapter, I will describe some of the common satellite data formats you may encounter.
References
1 Dask: Scalable analytics in Python. (n.d.). Retrieved November 25, 2020, from https://dask.org/
2 ecmwf/cfgrib. (2020). Python, European Centre for Medium‐Range Weather Forecasts. Retrieved from https://github.com/ecmwf/cfgrib(Original work published July 16, 2018).
3 Matplotlib: Python plotting — Matplotlib 3.3.3 documentation. (n.d.). Retrieved November 25, 2020, from https://matplotlib.org/.
4 MetPy — MetPy 0.12. (n.d.). Retrieved November 25, 2020, from https://unidata.github.io/MetPy/latest/index.html.
5 NumPy. (n.d.). Retrieved November 25, 2020, from https://numpy.org/
6 Overview: Why xarray? — xarray 0.16.2.dev3+g18a59a6d.d20200920 documentation. (n.d.). Retrieved November 25, 2020, from http://xarray.pydata.org/en/stable/why‐xarray.html.
7 pandas documentation — pandas 1.1.4 documentation. (n.d.). Retrieved November 25, 2020, from https://pandas.pydata.org/pandas‐docs/stable/index.html.
8 Vaze, P., Neeck, S., Bannoura, W., Green, J., Wade, A., Mignogno, M., et al. (2010). The Jason‐3 Mission: completing the transition of ocean altimetry from research to operations. In R. Meynart, S. P. Neeck, & H. Shimoda (Eds.) (p. 78260Y). Presented at the Remote Sensing, Toulouse, France. https://doi.org/10.1117/12.868543.
Конец ознакомительного фрагмента.
Текст предоставлен ООО «ЛитРес».
Прочитайте эту книгу целиком, купив полную легальную версию на ЛитРес.
Безопасно оплатить книгу можно банковской картой Visa, MasterCard, Maestro, со счета мобильного телефона, с платежного терминала, в салоне МТС или Связной, через PayPal, WebMoney, Яндекс.Деньги, QIWI Кошелек, бонусными картами или другим удобным Вам способом.
Интервал:
Закладка:
Похожие книги на «Earth Observation Using Python»
Представляем Вашему вниманию похожие книги на «Earth Observation Using Python» списком для выбора. Мы отобрали схожую по названию и смыслу литературу в надежде предоставить читателям больше вариантов отыскать новые, интересные, ещё непрочитанные произведения.


Обсуждение, отзывы о книге «Earth Observation Using Python» и просто собственные мнения читателей. Оставьте ваши комментарии, напишите, что Вы думаете о произведении, его смысле или главных героях. Укажите что конкретно понравилось, а что нет, и почему Вы так считаете.