Rebekah B. Esmaili - Earth Observation Using Python
Здесь есть возможность читать онлайн «Rebekah B. Esmaili - Earth Observation Using Python» — ознакомительный отрывок электронной книги совершенно бесплатно, а после прочтения отрывка купить полную версию. В некоторых случаях можно слушать аудио, скачать через торрент в формате fb2 и присутствует краткое содержание. Жанр: unrecognised, на английском языке. Описание произведения, (предисловие) а так же отзывы посетителей доступны на портале библиотеки ЛибКат.
- Название:Earth Observation Using Python
- Автор:
- Жанр:
- Год:неизвестен
- ISBN:нет данных
- Рейтинг книги:5 / 5. Голосов: 1
-
Избранное:Добавить в избранное
- Отзывы:
-
Ваша оценка:
Earth Observation Using Python: краткое содержание, описание и аннотация
Предлагаем к чтению аннотацию, описание, краткое содержание или предисловие (зависит от того, что написал сам автор книги «Earth Observation Using Python»). Если вы не нашли необходимую информацию о книге — напишите в комментариях, мы постараемся отыскать её.
Earth Observation Using Python: A Practical Programming Guide Gain Python fluency using real data and case studies Read and write common scientific data formats, like netCDF, HDF, and GRIB2 Create 3-dimensional maps of dust, fire, vegetation indices and more Learn to adjust satellite imagery resolution, apply quality control, and handle big files Develop useful workflows and learn to share code using version control Acquire skills using online interactive code available for all examples in the book The American Geophysical Union promotes discovery in Earth and space science for the benefit of humanity. Its publications disseminate scientific knowledge and provide resources for researchers, students, and professionals.
Earth Observation Using Python — читать онлайн ознакомительный отрывок
Ниже представлен текст книги, разбитый по страницам. Система сохранения места последней прочитанной страницы, позволяет с удобством читать онлайн бесплатно книгу «Earth Observation Using Python», без необходимости каждый раз заново искать на чём Вы остановились. Поставьте закладку, и сможете в любой момент перейти на страницу, на которой закончили чтение.
Интервал:
Закладка:
1.1 History of Computational Scientific Visualization
Scientific data visualizing used to be a very tedious process. Prior to the 1970s, data points were plotted by hand using devices such as slide rules, French curls, and graph paper. During the 1970s, IBM mainframes became increasingly available at universities and facilitated data analysis on the computer. For analysis, IBM mainframes required that a researcher write Fortran‐IV code, which was then printed to cards using a keypunch machine ( Figure 1.1). The punch cards then were manually fed into a shared university computer to perform calculations. Each card is roughly one line of code. To make plots, the researcher could create a Fortran program to make an ASCII plot, which creates a plot by combining lines, text, and symbols. The plot could then be printed to a line‐printer or a teleprinter. Some institutions had computerized graphic devices, such as Calcomp plotters. Rather than create ASCII plots, the researcher could use a Calcomp plotting command library to control how data were visualized and store the code on computer tape. The scientist would then take the tape to a plotter, which was not necessarily (or usually) in the same area as the computer or keypunch machine. Any errors – such as bugs in the code, damaged punch cards, or damaged tape – meant the whole process would have to be repeated from scratch.
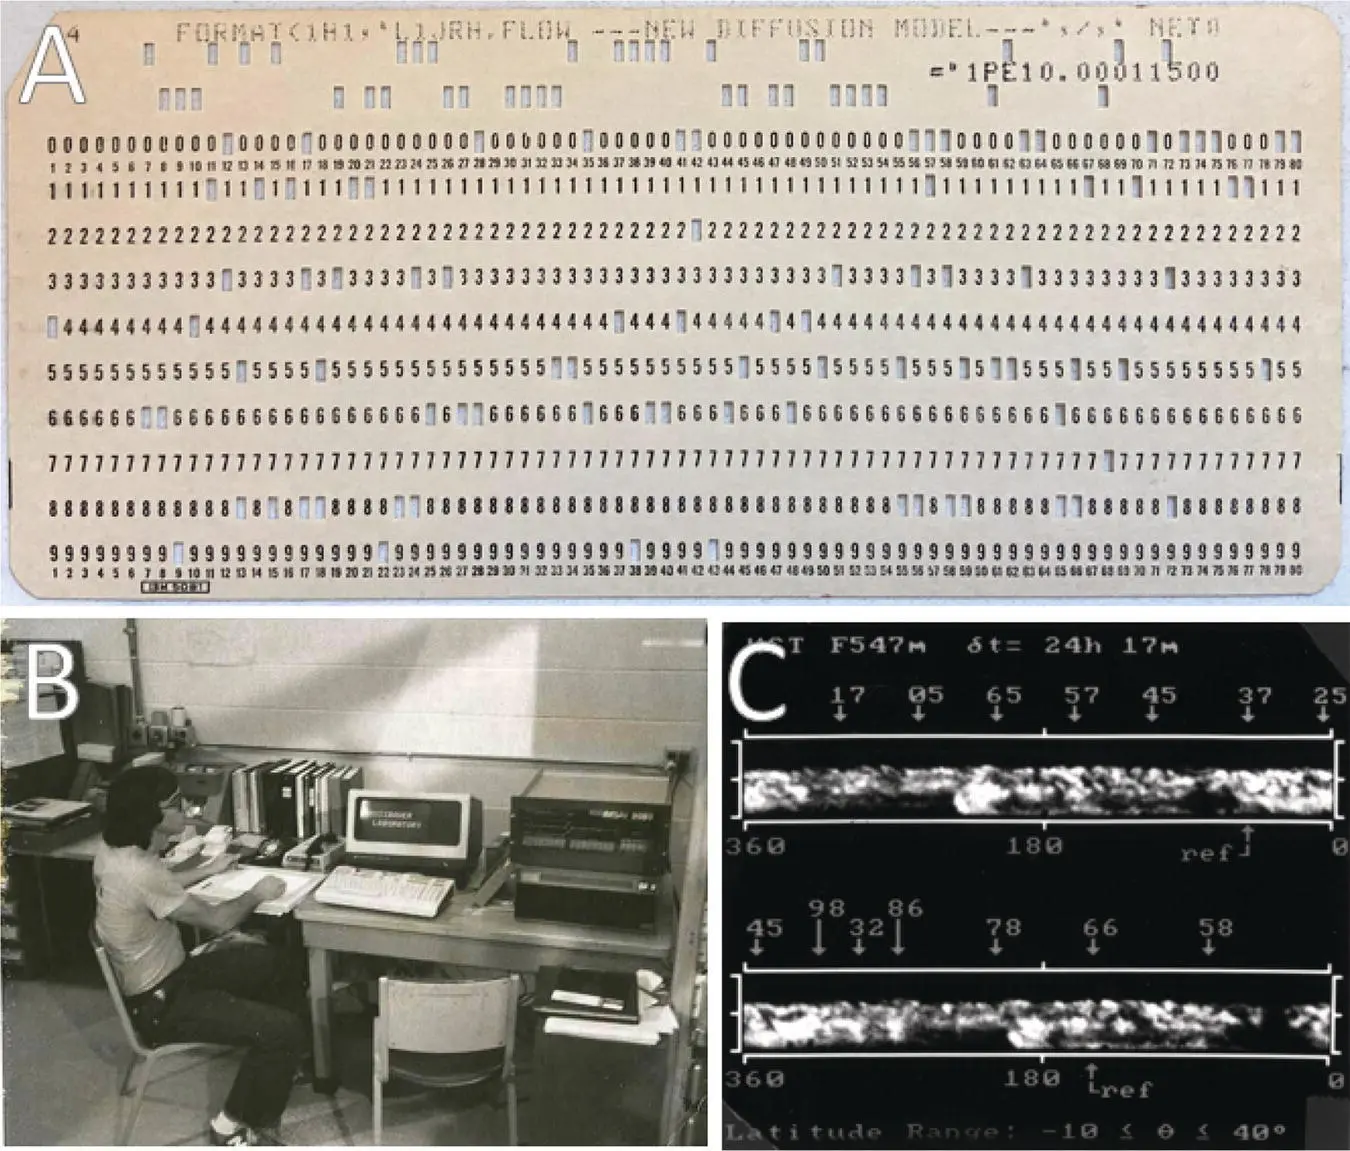
Figure 1.1 (a) An example of a Fortran punch card. Each vertical column represents a character and one card roughly one line of Fortran code. (b) 1979 photo of an IMSAI 8080 computer that could store up to 32 kB of the data, which could then be transferred to a keypunch machine to create punch cards. (c) an image created from the Hubble Space Telescope using a Calcomp printer, which was made from running punch cards and plotting commands through a card reader.
In the mid‐1980s, universities provided remote terminals that would eventually replace the keypunch and card reader machine system. This substantially improved data visualization processes, as scientists no longer had to share limited resources such as keypunch machines, card readers, or terminals. By the late 1980s, personal computers became more affordable for scientists. A typical PC, such as the IBM XT 286, had 640 Kb of random access memory, a 32 MB hard drive, and 5.25 inch floppy disks with 1.2 MB of disk storage (IBM, 1989). At this time, pen plotters became increasingly common for scientific visualization, followed later by the prevalence of ink‐jet printers in the 1990s. These technologies allowed researchers to process and visualize data conveniently from their offices. With the proliferation of user‐friendly person computers, printers eventually made their way into all homes and offices.
Now with advances in computing and internet access, researchers no longer need to print their visualizations at all, but often keep data in digital form only. Plots can be created in various data formats that easily embed into digital presentations and documents. Scientists often do not ever print visualizations because computers and cloud storage can store many gigabytes of data. Information is created and consumed entirely in digital form. Programming languages, such as Python, can tap into high‐level plotting programs and can minimize the axis calculation and labeling requirements within a plot. Thus, the expanded access to computing tools and simplified processes have advanced scientific data visualization opportunities.
1.2 Brief Catalog of Current Satellite Products
In Figure 1.2, you can see that the international community has developed and launched a plethora of Earth‐observing satellites, each with several onboard sensors that have a range of capabilities. I am not able to discuss every sensor, dataset, and mission(a term coined by NASA to describe projects involving spacecraft). However, I will describe some that are relevant to this text, organized by subject area.
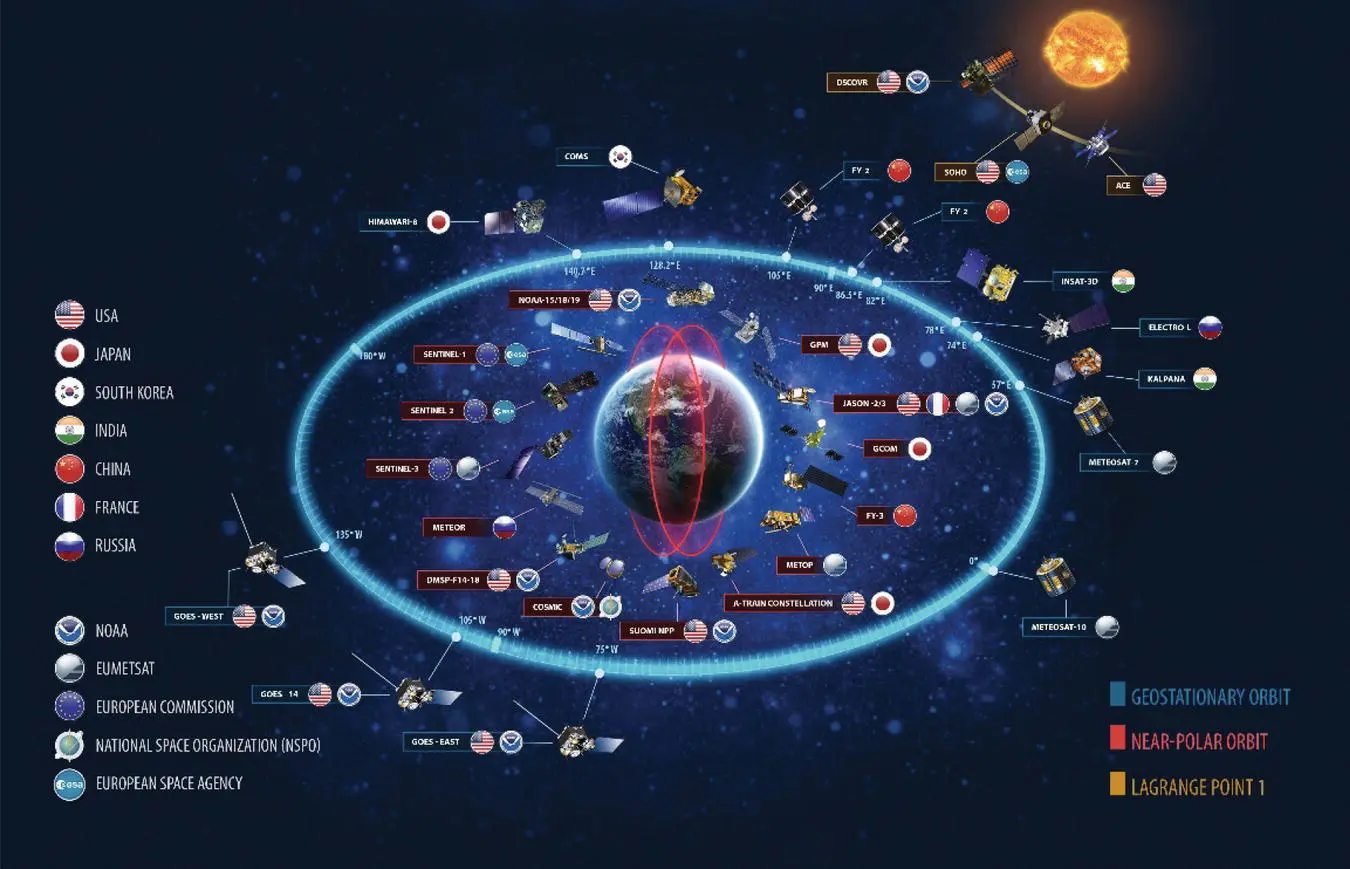
Figure 1.2 Illustration of current Earth, space weather, and environmental monitoring satellites from the World Meteorological Organization (WMO). Source: U.S. Department of Commerce / NOAA / Public Domain.
1.2.1 Meteorological and Atmospheric Science
Most Earth‐observing satellites orbit our planet either in either geostationaryor low‐Earth orbitingpatterns. These types of satellites tend to be managed and operated by large international government agencies, and the data are often freely accessible online:
Geosynchronous equatorial orbit (GEO) satellites. Geostationary platforms orbit the Earth at 35,700 km above the Earth’s surface. GEO satellites are designed to continuously monitor the same region on Earth, and thus can provide many images over a short period of time to monitor change. National Oceanic and Atmospheric Administration (NOAA) operates the Geostationary Environmental Satellite System (GOES) satellites for monitoring North and South America. GOES‐16 and ‐17 have an advanced baseline instrument (ABI) onboard to create high‐resolution imagery in visible and infrared (IR) wavelengths. The GOES‐16 and ‐17 satellites are also equipped with the Geostationary Lightning Mapper (GLM) to detect lightning. Instruments designed for space weather include the Solar Ultraviolet Imager (SUVI) and X‐ray Irradiance Sensors (EXIS). The European Organization for the Exploitation of Meteorological Satellites (EUMETSAT) operates and maintains the Meteosat series GEO satellites that monitor Europe and Africa. The Japan Aerospace Exploration Agency (JAXA) operates and maintains the Himawari satellite that monitors Asia and Oceania.
Low‐Earth orbit (LEO) satellites. Polar orbiting satellites provide approximately twice daily global observations at the equator (with more observations per day at the poles). Figure 1.3displays the equatorial crossing time for historic and existing LEO satellites, which refers to the local time at the equator when observations are made. Overpasses from some LEO satellites shift during a mission, while others are periodically adjusted back to maintain a consistent overpass time throughout the duration of a mission. Polar orbiting satellites are called low‐Earth orbit satellites because they are much closer to the Earth’s surface (at 400–900 km) than GEO satellites, which are approximately 40 times further away from the earth or at ~35,000 km. The lower altitude of LEO satellites facilitates their higher spatial resolution relative to GEO, although the temporal resolution tends to be lower for LEO satellites. The Suomi‐NPP and NOAA‐20 are two satellites that were developed and maintained by NASA and NOAA, respectively. They are each equipped with an imager, the Visible Infrared Imaging Radiometer Suite (VIIRS), and infrared and microwave sounders, the Cross‐track Infrared Sounder (CrIS) and an Advanced Technology Microwave Sounder (ATMS). The MetOp series of LEO satellites (named MetOp‐A, ‐B, and ‐C) were developed by the European Space Agency (ESA) and are operated by EUMETSAT.
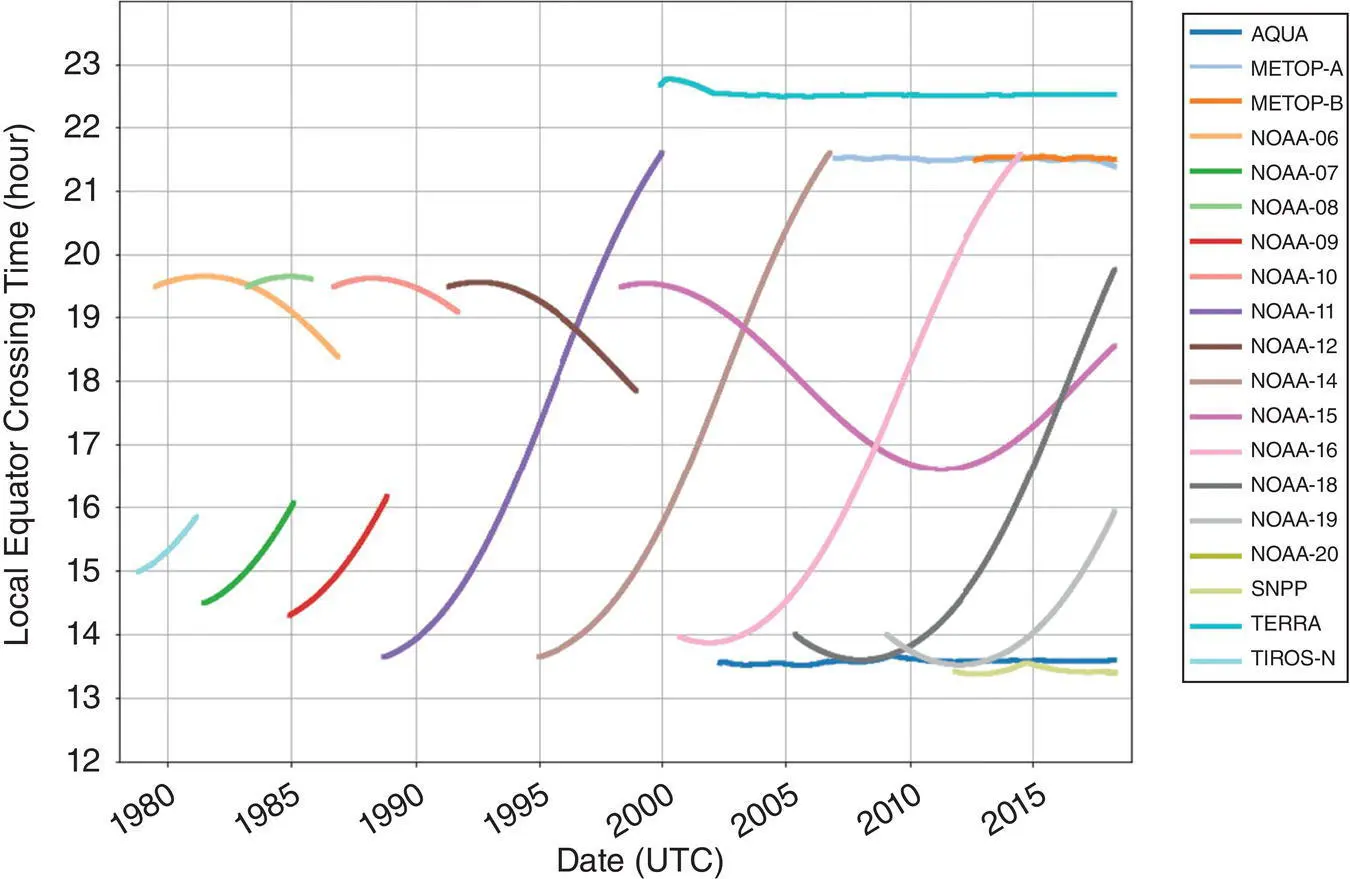
Figure 1.3 Equatorial crossing times for various LEO satellites displayed using Python.
Читать дальшеИнтервал:
Закладка:
Похожие книги на «Earth Observation Using Python»
Представляем Вашему вниманию похожие книги на «Earth Observation Using Python» списком для выбора. Мы отобрали схожую по названию и смыслу литературу в надежде предоставить читателям больше вариантов отыскать новые, интересные, ещё непрочитанные произведения.


Обсуждение, отзывы о книге «Earth Observation Using Python» и просто собственные мнения читателей. Оставьте ваши комментарии, напишите, что Вы думаете о произведении, его смысле или главных героях. Укажите что конкретно понравилось, а что нет, и почему Вы так считаете.