Global Drought and Flood
Здесь есть возможность читать онлайн «Global Drought and Flood» — ознакомительный отрывок электронной книги совершенно бесплатно, а после прочтения отрывка купить полную версию. В некоторых случаях можно слушать аудио, скачать через торрент в формате fb2 и присутствует краткое содержание. Жанр: unrecognised, на английском языке. Описание произведения, (предисловие) а так же отзывы посетителей доступны на портале библиотеки ЛибКат.
- Название:Global Drought and Flood
- Автор:
- Жанр:
- Год:неизвестен
- ISBN:нет данных
- Рейтинг книги:5 / 5. Голосов: 1
-
Избранное:Добавить в избранное
- Отзывы:
-
Ваша оценка:
Global Drought and Flood: краткое содержание, описание и аннотация
Предлагаем к чтению аннотацию, описание, краткое содержание или предисловие (зависит от того, что написал сам автор книги «Global Drought and Flood»). Если вы не нашли необходимую информацию о книге — напишите в комментариях, мы постараемся отыскать её.
Global Drought and Flood: Observation, Modeling, and Prediction Volume highlights include:
Remote sensing approaches for mapping droughts and floods Physical and statistical models for monitoring and forecasting hydrologic hazards Features of various drought and flood systems and products Use by governments, humanitarian, and development stakeholders in recent disaster cases Improving the collaboration between hazard information provision and end users The American Geophysical Union promotes discovery in Earth and space science for the benefit of humanity. Its publications disseminate scientific knowledge and provide resources for researchers, students, and professionals.
Global Drought and Flood — читать онлайн ознакомительный отрывок
Ниже представлен текст книги, разбитый по страницам. Система сохранения места последней прочитанной страницы, позволяет с удобством читать онлайн бесплатно книгу «Global Drought and Flood», без необходимости каждый раз заново искать на чём Вы остановились. Поставьте закладку, и сможете в любой момент перейти на страницу, на которой закончили чтение.
Интервал:
Закладка:
Assuming that the three kinds of errors are uncorrelated and
(2.31) 
we obtain the RMSE values for MWSM ( ξ MWSM), ESI ( ξ ESI), and NLSM ( ξ NLSM) as the following (Miralles et al., 2010; Scipal et al., 2008; Stoffelen, 1998):
(2.32) 
(2.33) 
(2.34) 
Thus, based on the TCEM, the monthly RMSEs for each of the data sets can be estimated grid by grid regionally or globally.
The procedure of generating the best Blended Drought Index (BDI_b) for each pixel in the global domain is described in Figure 2.5. Each pixel is filled by the retrieval that is estimated to have the lowest RMSE estimated from the TCEM, which ensures that all pixels across the global domain can be covered by the best available drought estimation information, instead of integrating the evaluations by building their weights. The monthly TCEM‐based RMSE for each of the six soil moisture retrievals used in this study can characterize their time series throughout the year.
The severe drought caused by the great Russian heat wave of 2010 lead to extensive wildfires and thousands of human deaths (Barriopedro et al., 2011). The 2010 western Russia drought started in May and lasted through November in response to the record‐breaking high temperature caused by a very strong La Niña event (Barriopedro et al., 2011; Kogan et al., 2013). The monthly BDI_b results effectively capture the documented droughts in western Russia in 2010 ( Figure 2.6).
Figure 2.5 The procedure for constructing the BDI_b using the RMSEs estimated from the triple collocation error model implemented for each grid in each calendar month. RMSE minis the minimum RMSE for a grid, and RMSE SMOPS, RMSE NLSM, and RMSE ESIare the monthly RMSE values for soil moisture data sets from SMOPS, NLSM, and ESI cases, respectively.
( Source: From Yin, J., Zhan, X., Hain, C. R., Liu, J., & Anderson, M. C. (2018). A Method for Objectively Integrating Soil Moisture Satellite Observations and Model Simulations Toward a Blended Drought Index. Water Resources Research, 54(9), 6772–6791. © 2018, John Wiley & Sons.)
The 2011 drought over the Southern Great Plains of the United States seriously affected agriculture, severely impacted crop and livestock sectors, and significantly influenced food prices at the retail level (Grigg, 2014; Tadesse et al., 2015) with the State of Texas experiencing its driest year since 1895 (Hoerling et al., 2014). This severe drought started in November 2010 and lasted through October 2011, and the dry situation was mitigated across the southeast Texas Panhandle and eastern Rolling Plains in November 2011 by heavy precipitation (Tadesse et al., 2015). The BDI_b perfectly exhibits the drought episodes ( Figure 2.7).
With respect to the reported drought records and the drought monitoring benchmarks including the US Drought Monitor, the Palmer Drought Severity Index and the standardized precipitation evapotranspiration index products, the BDI_b was compared with the simple average BDI and the RMSE‐weighted average BDI (Yin et al., 2018). The BDI_b performs more consistently with the drought monitoring benchmarks. With respect to the official drought records, the developed BDI_b shows the best performance on tracking drought development in terms of time evolution and spatial patterns of the 2010 Russia, 2011 United States, 2013, and New Zealand droughts, as well as other reported agricultural drought occurrences over the 2009–2014 period (Yin et al., 2018).
Figure 2.6 Monthly BDI_b for the Russian (from 40°N, 20°E to 70°N, 80°E) domain in 2010.
( Source: From Yin, J., Zhan, X., Hain, C. R., Liu, J., & Anderson, M. C. (2018). A Method for Objectively Integrating Soil Moisture Satellite Observations and Model Simulations Toward a Blended Drought Index. Water Resources Research, 54(9), 6772–6791. © 2018, John Wiley & Sons.)
2.6. DISCUSSION
In this chapter we briefly reviewed the history of studies of estimating land surface evapotranspiration at local to global scales using remote sensing approaches. The thermal remote sensing approach using the ALEXI model is categorized as probably one of the most reliable. Based on the ALEXI model the GET‐D product system using GOES‐13 and GOES‐15 observations has been developed and made operational at the NESDIS of NOAA. Upgrading the GET‐D system to use the most recently installed GOES‐16 and GOES‐17 observations is ongoing. For global remote sensing of ET and monitoring of drought based on ET estimates, the ALEXI model using the thermal observations from NOAA operational observations of VIIRS onboard the Suomi National Polar‐orbiting Partnership and Joint Polar Satellite System satellites has been demonstrated to be promising (Hain et al., 2017). More intercomparison and validation studies using approaches based on the ALEXI model, the PM equation, the PT equation, and other methods for globally estimating and monitoring drought are needed.
ACKNOWLEDGMENTS
This study has been supported by NOAA and NASA programs including NOAA GOES‐R Risk Reduction program, NOAA NESDIS PSDI program, NOAA JPSS Proving Ground and Risk Reduction Program, and NASA Applied Science Program. Contents of this chapter are solely the opinions of the author(s) and do not constitute a statement of policy, decision, or position on behalf of NOAA or the US Government.
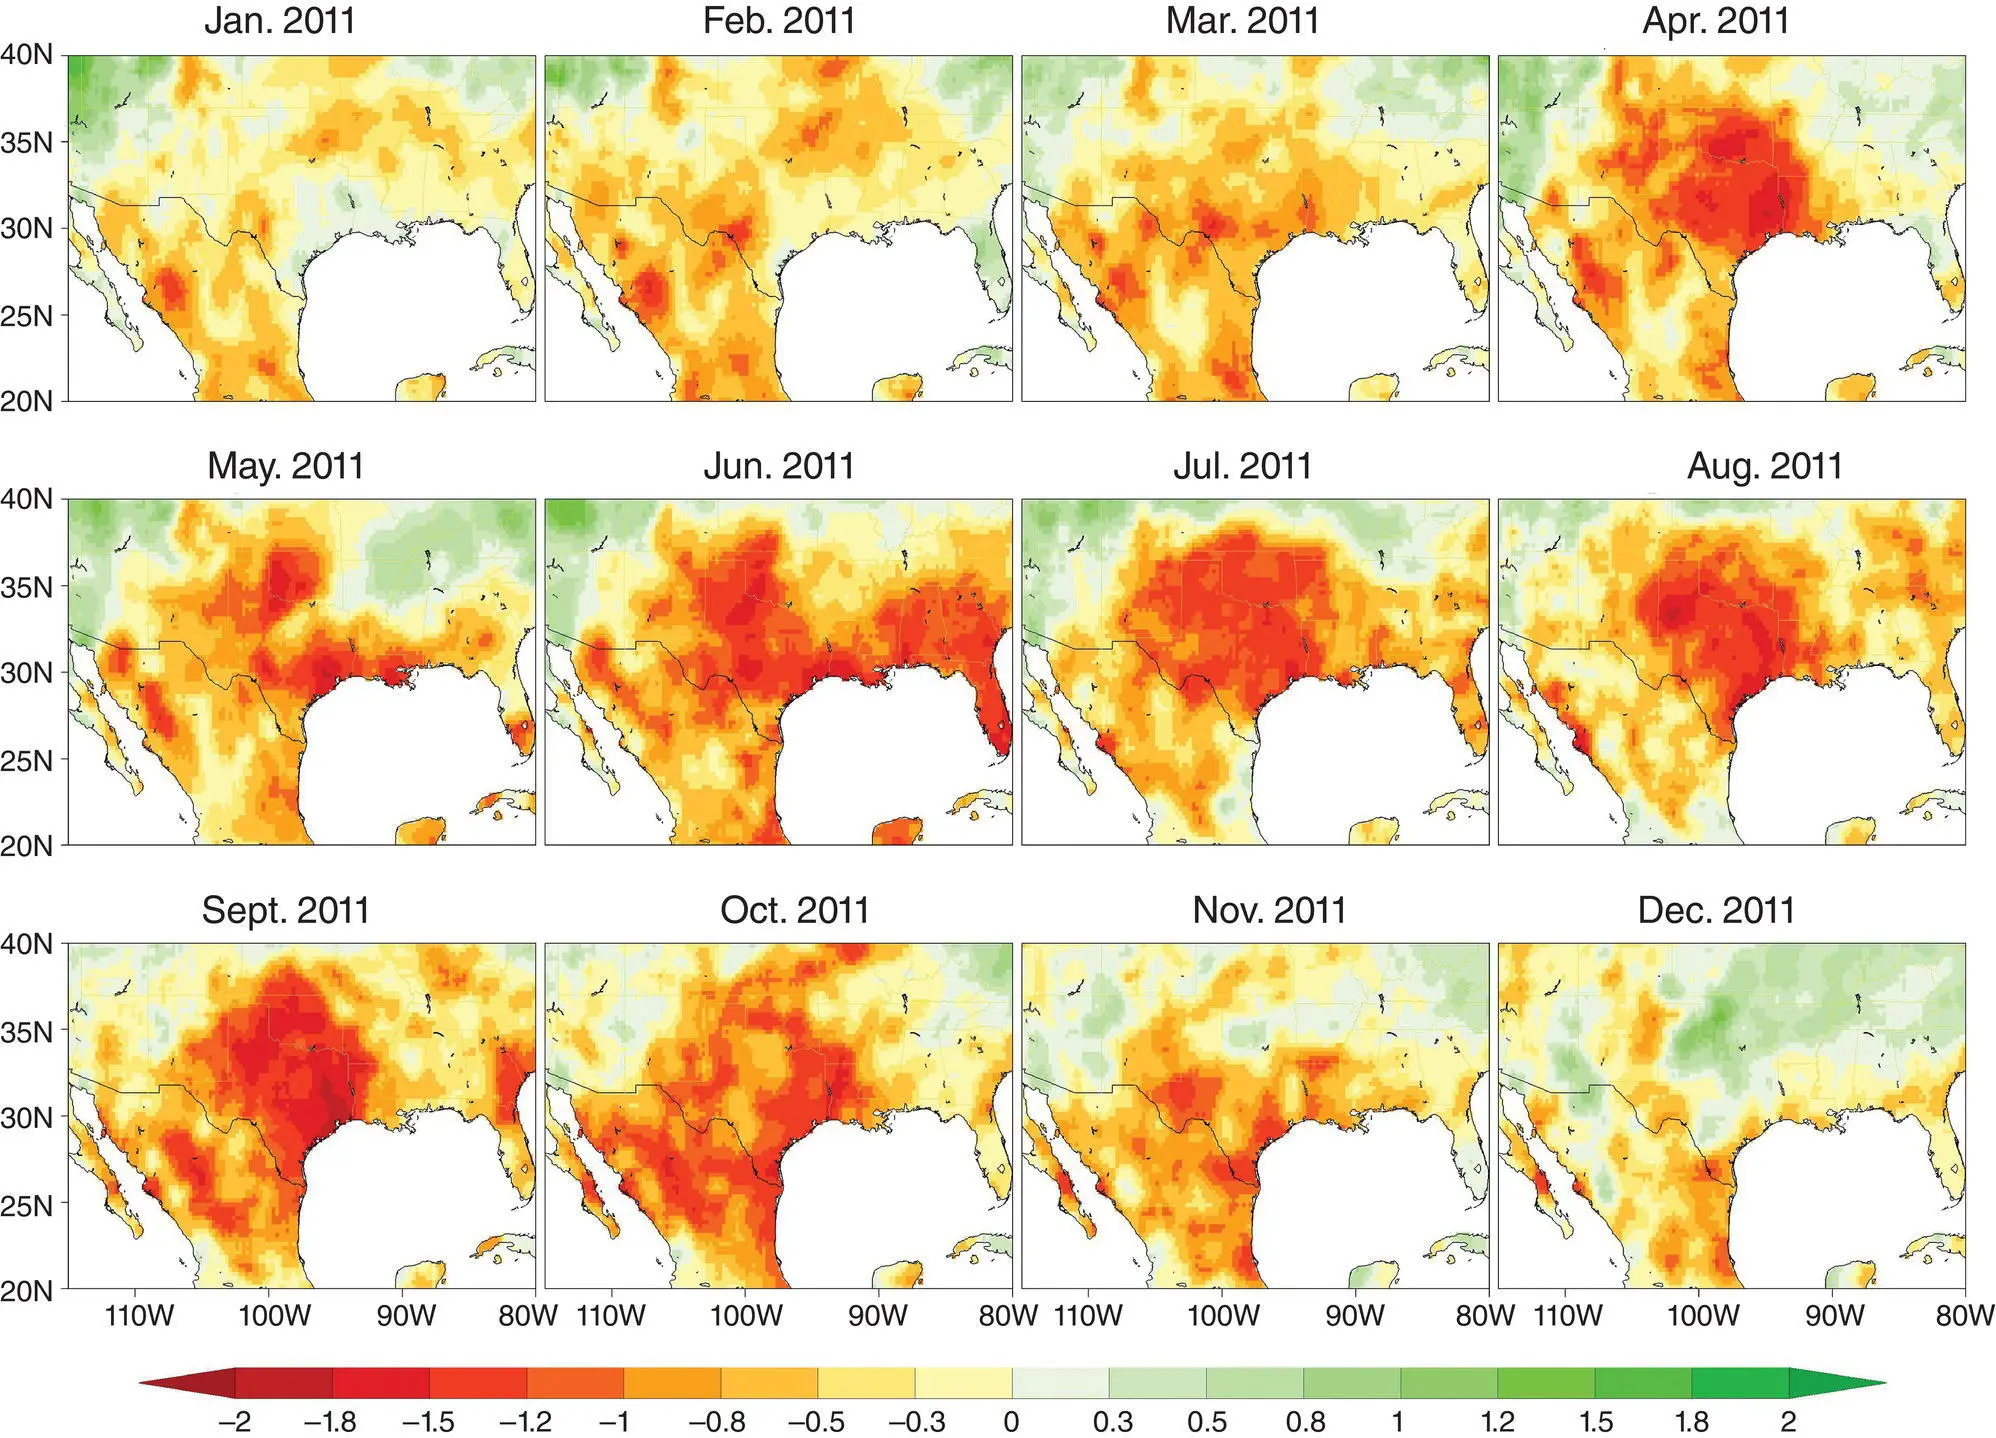
Figure 2.7 Monthly BDI_b for the southern United States (from 25°N, −115°W to 40°N, −90°W) domain in 2011.
( Source: From Yin, J., Zhan, X., Hain, C. R., Liu, J., & Anderson, M. C. (2018). A Method for Objectively Integrating Soil Moisture Satellite Observations and Model Simulations Toward a Blended Drought Index. Water Resources Research, 54(9), 6772–6791. © 2018, John Wiley & Sons.)
REFERENCES
1 Allen, R., Irmak, A., Trezza, R., Hendrickx, J.M.H., Bastiaanssen, W., & Kjaersgaard, J. (2011). Satellite‐based ET estimation in agriculture using SEBAL and METRIC. Hydrological Processes, 25(26), 4011–4027. doi:10.1002/hyp.8408
2 Allen, R.G., Tasumi, M., Morse, A., & Trezza, R. (2005). A Landsat‐based energy balance and evapotranspiration model in Western US water rights regulation and planning. Irrigation and Drainage Systems, 19, 251–268.
3 Allen, R.G., Tasumi, M., & Trezza, R. (2007). Satellite‐based energy balance for mapping evapotranspiration with internalized calibration (METRIC)—Model. Journal of Irrigation and Drainage Engineering—ASCE, 133(4), 380–394. doi:10.1061/(asce)0733‐9437(2007)133:4(380)
Читать дальшеИнтервал:
Закладка:
Похожие книги на «Global Drought and Flood»
Представляем Вашему вниманию похожие книги на «Global Drought and Flood» списком для выбора. Мы отобрали схожую по названию и смыслу литературу в надежде предоставить читателям больше вариантов отыскать новые, интересные, ещё непрочитанные произведения.


Обсуждение, отзывы о книге «Global Drought and Flood» и просто собственные мнения читателей. Оставьте ваши комментарии, напишите, что Вы думаете о произведении, его смысле или главных героях. Укажите что конкретно понравилось, а что нет, и почему Вы так считаете.