Global Drought and Flood
Здесь есть возможность читать онлайн «Global Drought and Flood» — ознакомительный отрывок электронной книги совершенно бесплатно, а после прочтения отрывка купить полную версию. В некоторых случаях можно слушать аудио, скачать через торрент в формате fb2 и присутствует краткое содержание. Жанр: unrecognised, на английском языке. Описание произведения, (предисловие) а так же отзывы посетителей доступны на портале библиотеки ЛибКат.
- Название:Global Drought and Flood
- Автор:
- Жанр:
- Год:неизвестен
- ISBN:нет данных
- Рейтинг книги:5 / 5. Голосов: 1
-
Избранное:Добавить в избранное
- Отзывы:
-
Ваша оценка:
Global Drought and Flood: краткое содержание, описание и аннотация
Предлагаем к чтению аннотацию, описание, краткое содержание или предисловие (зависит от того, что написал сам автор книги «Global Drought and Flood»). Если вы не нашли необходимую информацию о книге — напишите в комментариях, мы постараемся отыскать её.
Global Drought and Flood: Observation, Modeling, and Prediction Volume highlights include:
Remote sensing approaches for mapping droughts and floods Physical and statistical models for monitoring and forecasting hydrologic hazards Features of various drought and flood systems and products Use by governments, humanitarian, and development stakeholders in recent disaster cases Improving the collaboration between hazard information provision and end users The American Geophysical Union promotes discovery in Earth and space science for the benefit of humanity. Its publications disseminate scientific knowledge and provide resources for researchers, students, and professionals.
Global Drought and Flood — читать онлайн ознакомительный отрывок
Ниже представлен текст книги, разбитый по страницам. Система сохранения места последней прочитанной страницы, позволяет с удобством читать онлайн бесплатно книгу «Global Drought and Flood», без необходимости каждый раз заново искать на чём Вы остановились. Поставьте закладку, и сможете в любой момент перейти на страницу, на которой закончили чтение.
Интервал:
Закладка:
Major data inputs and outputs of the GET‐D system are provided in Table 2.1and Figure 2.2, respectively.
2.4.3. GET‐D System Outputs
Figure 2.3presents an example of the 2/4/8/12‐week composite of ESI generated from the GET‐D system at 8 km resolution over the North American domain on 22 September 2016. Near‐real time GET‐D data products based on GOES‐13 and GOES‐15 observations before 30 December 2017 were available from https://www.star.nesdis.noaa.gov/smcd/emb/droughtMon/products_droughtMon.php. GET‐D products based on GOES‐16 and GOES‐17 are being upgraded to higher spatial resolution and will be available to the public. Figure 2.4gives an example of the 2‐week ESI 2012 central United States flash drought between early June and mid‐August, compared with a precipitation index and the U.S. Drought Monitor index. The ESI represents standardized anomalies in the ET/PET ratio: negative anomalies indicate drier than normal conditions, whereas positive anomalies indicate wetter conditions. Large negative Rapid Change Index (RCI; Otkin et al., 2014) values in the top row indicate that moisture stress was rapidly increasing at the beginning of the summer. Impressive scope of the unusually rapid decrease in the ESI anomalies is clearly depicted by the large area of negative RCI values (see the circled area in the two columns at the right of Figure 2.4). Notably, initial appearance of negative RCI values led the introduction of severe drought in the U.S. Drought Monitor by more than 4 weeks.
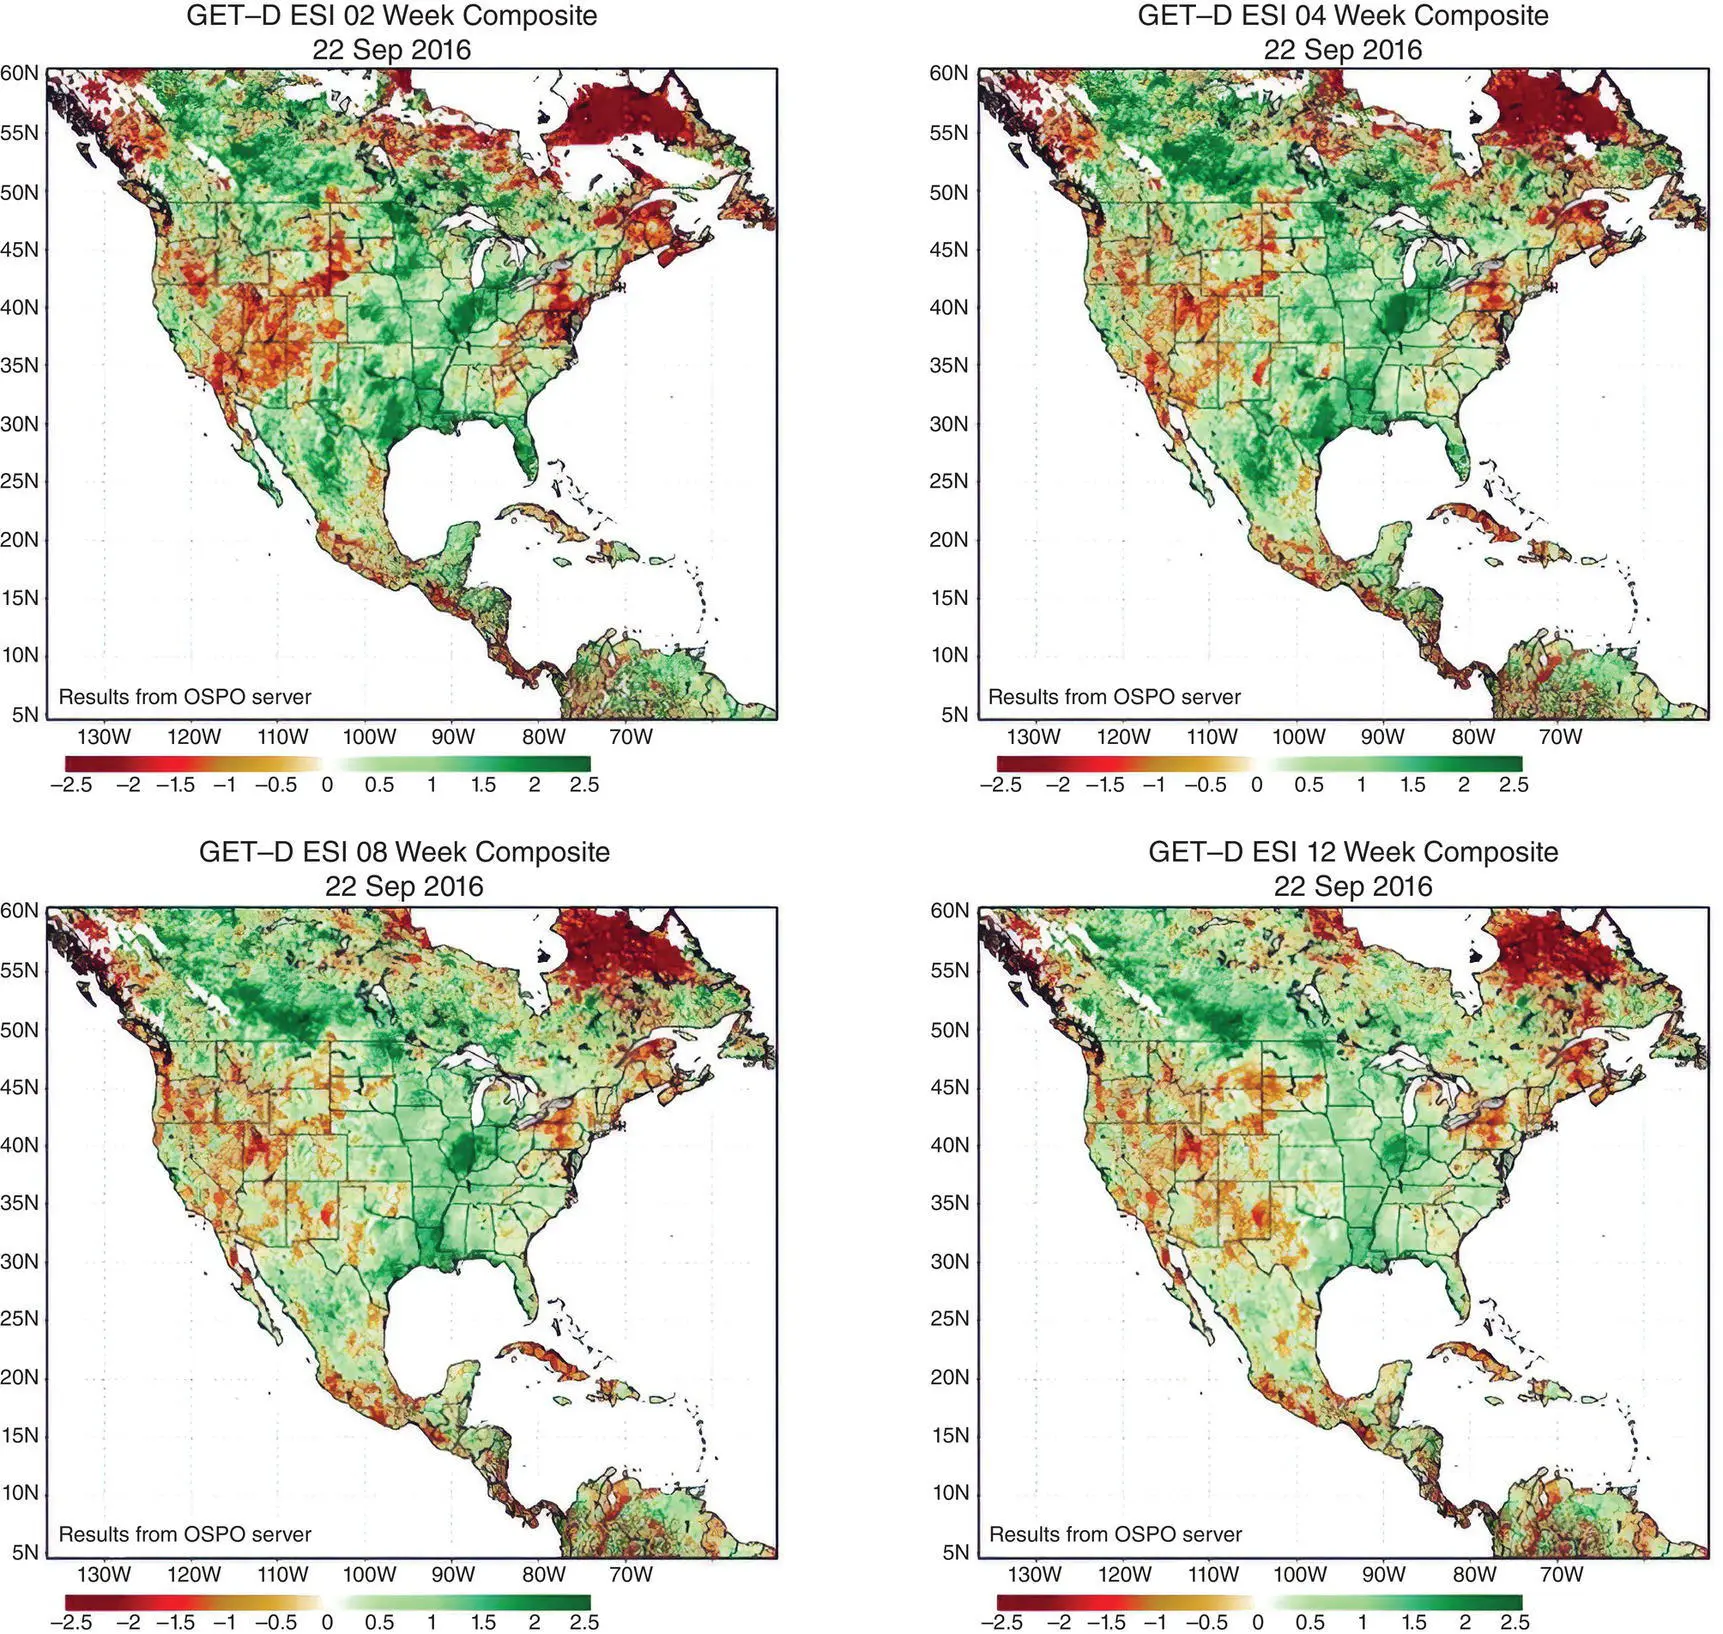
Figure 2.3 The 2/4/8/12‐week composite of ESI generated from the GET‐D system at 8 km resolution over the North American domain on 22 September 2016. OSPO, Office of Satellite and Product Operations. GET‐D data products based on GOES‐13 and GOES‐15 observations before 30 December 2017 were available from https://www.star.nesdis.noaa.gov/smcd/emb/droughtMon/products_droughtMon.php
( Source: National Oceanic and Atmospheric Administration, ESI generated from the GET‐D system, September 22, 2017.)
2.5. COMBINING ET REMOTE SENSING WITH MICROWAVE SOIL MOISTURE DATA FOR DROUGHT MONITORING
Evapotranspiration estimation and drought monitoring based on thermal satellite sensing suffers the problem of cloud contamination: land surface temperature, shortwave radiation, and vegetation status data retrieved from optical satellite sensors are available for clear days only and more than 50% of the Earth’s surface may be cloud covered on any one day. Because of the cloud penetration capability of microwaves, satellite sensors using L/C/X microwave bands have been used for observation of land surface soil moisture (Engman, 1991; Entekhabi et al., 2004; Jackson, 1993). Significant relationships between land surface temperature and Ka‐band microwave observations also have been found and used to estimate land surface temperature (Holmes et al., 2009; McFarland et al., 1990), which provides a possibility of estimating ET with the ALEXI model using microwave data. In this session we introduce a new approach, the triple collocation error model (TCEM), for objectively blending microwave soil moisture observations with ALEXI‐based ET estimates for drought monitoring (Yin et al., 2018).
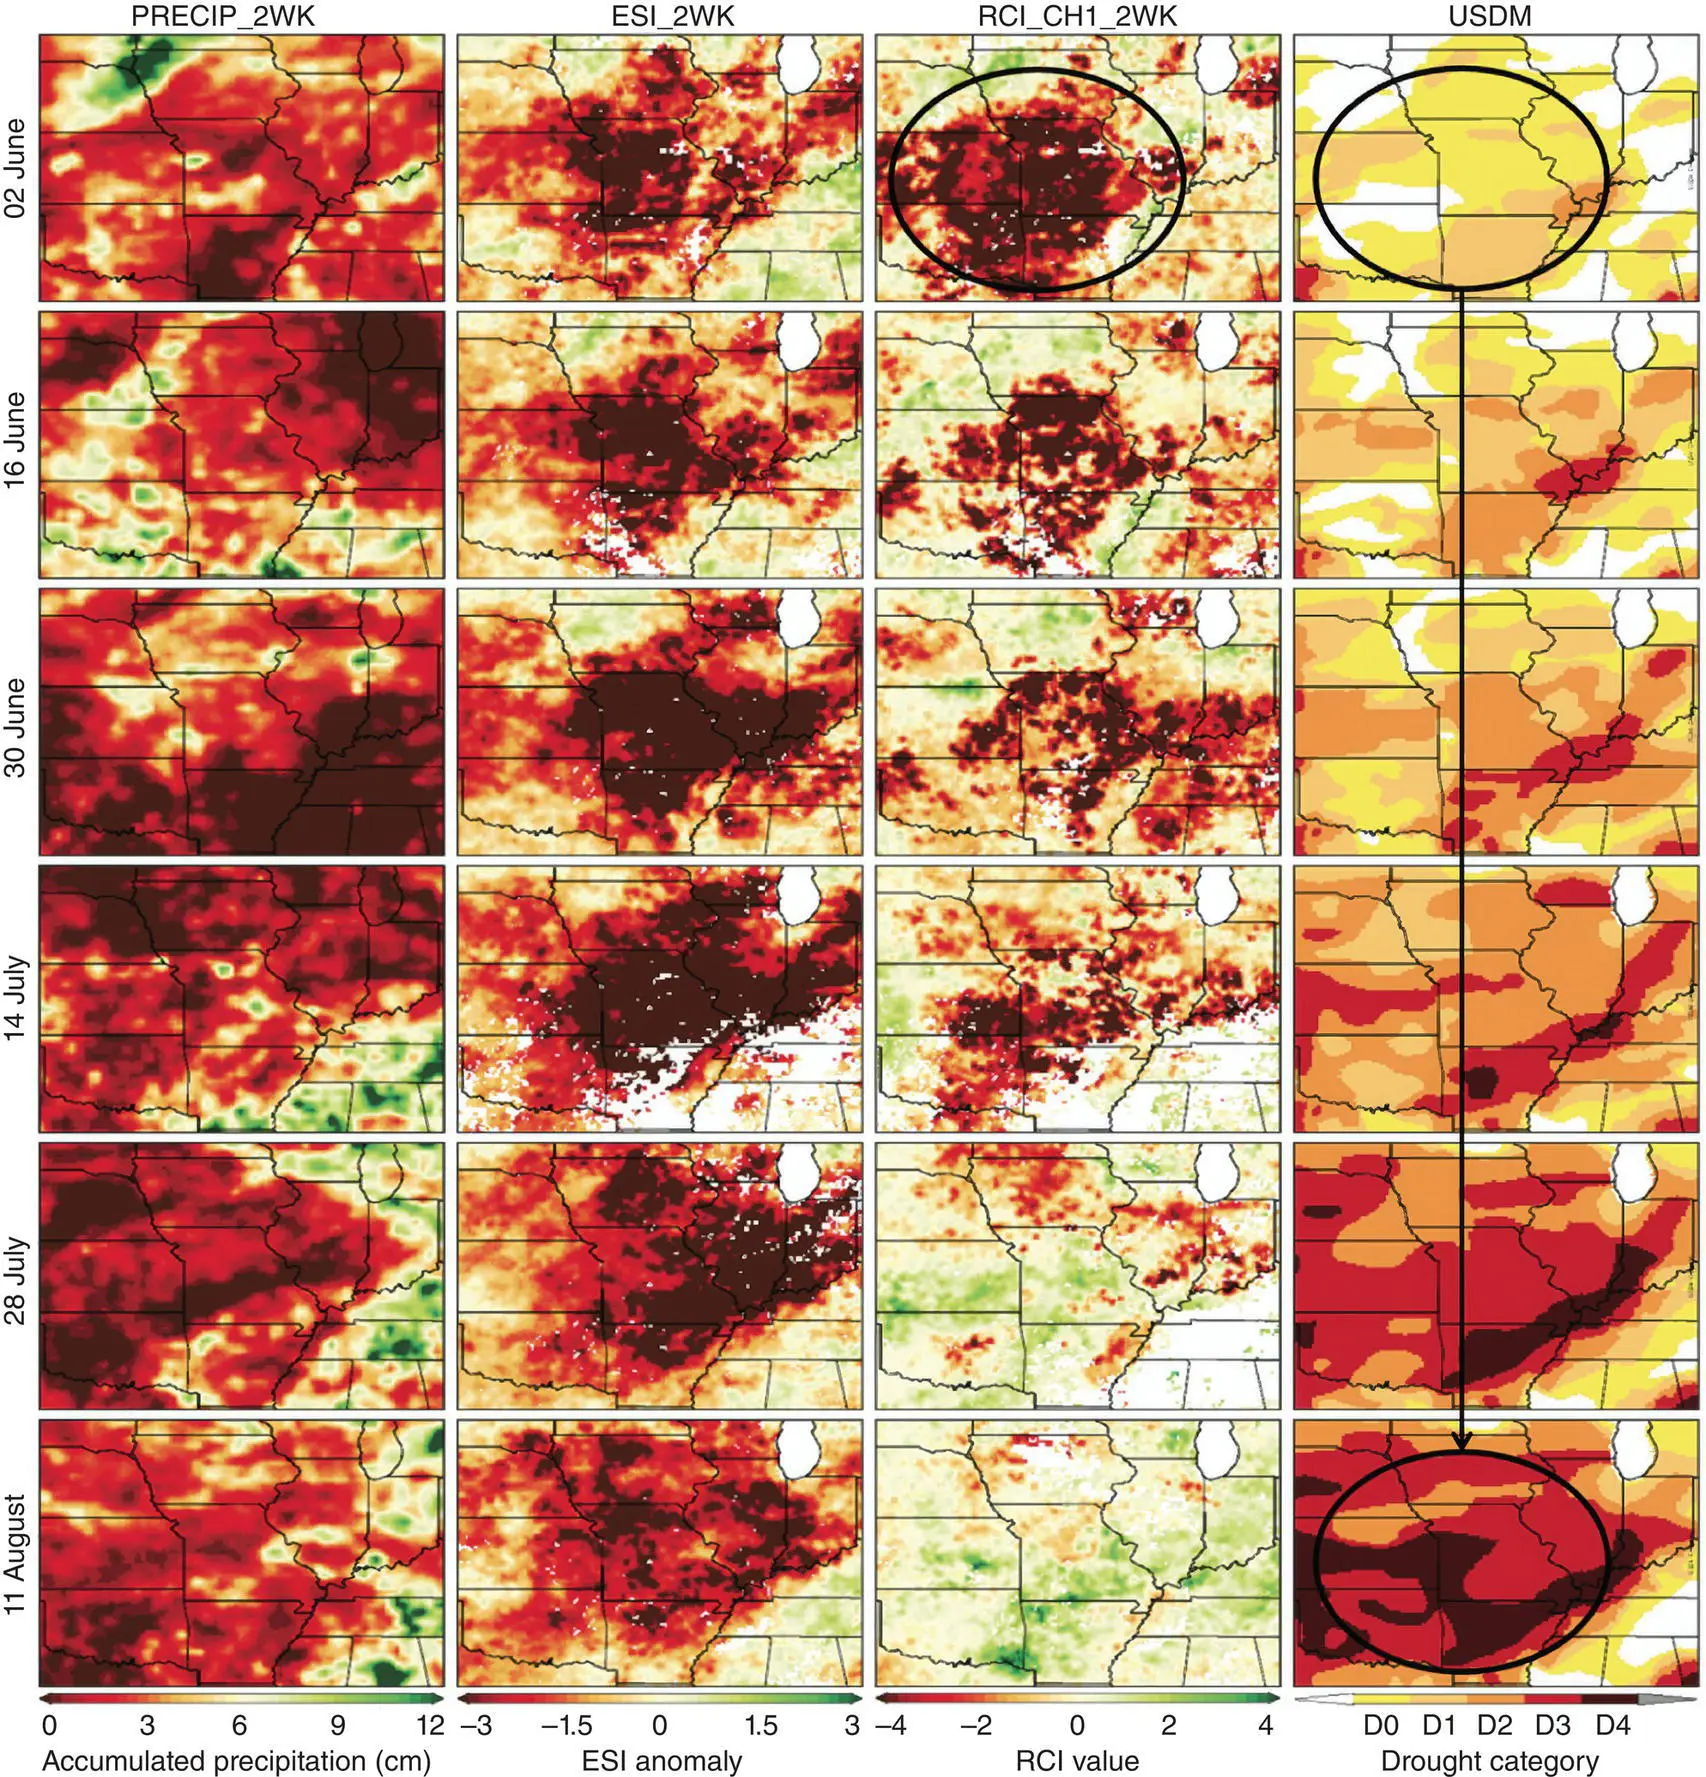
Figure 2.4 The unique characteristics of Rapid Change Index (RCI) values for the 2012 central United States flash drought. Unusual negative values in June in the circled central Midwest provided an early warning for the flash drought in August.
( Source: From Otkin, J. A., M. C. Anderson, C. Hain, and M. Svoboda, 2014. Examining the relationship between drought development and rapid changes in the Evaporative Stress Index. J. Hydrometeor., 15, 938–956. © American Meteorological Society.)
The TCEM assumes that the uncertainties or errors of the three retrieval sources are from mutually distinct sources and are independent of each other (Scipal et al., 2008). Here, the TCEM is based on three categories of soil‐moisture data sets that provide 25 km grid‐scale soil moisture (SM) estimations: (a) the Noah land surface model (NLSM), which is subject to errors in the model representation and in the meteorological forcing data; (b) the ESI developed by the ALEXI model, which does not use any precipitation input, but is sensitive to the accuracy of the thermal infrared (TIR) satellite LST and other model inputs (e.g., vegetation cover, available energy); and (c) the microwave satellite retrievals which are based on land surface microwave radiation physics, with error sources being microwave satellite sensor signal/noise ratio and soil moisture retrieval algorithm accuracy.
All of the data used here were temporally composited over 4‐week intervals. Then the uncertainty or root‐mean‐square error (RMSE) for each of the four microwave SM products was individually computed in combination with NLSM and ESI in TCEM in order to meet the error independence requirement of the three data sets used in TCEM. Meanwhile, the NLSM and ESI data sets were evaluated four times with each corresponding to a different microwave SM data set. Their errors were calculated as the average of the four RMSE values respectively. The climatology of each of the above‐mentioned soil moisture data sets were generated by assembling the variable values for a particular calendar week for all years of the study periods. Once the climatology was assembled, the standardized anomalies (ψ) were computed for week w , year y , and grid location ( i , j ), as
(2.27) 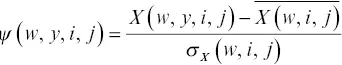
where  and σ xare climatology and climatological standard deviations for each of the six retrievals. Thus, drought estimations for microwave satellite retrieved soil moisture (MWSM; ψ MWSM), ESI ( ψ ESI), and NLSM ( ψ NLSM) are then expressed as (Janssen et al., 2007; Scipal et al., 2008)
(2.28) 
(2.29) 
(2.30) 
where Π indicates the true drought status, and μ , ω . and ρ denote the unknown errors in the MWSM, the ESI based on thermal remotely sensed evapotranspiration, and NLSM. The ESI data from GET‐D were generated only for the North America domain as described in the previous section. For this study we have developed a new and novel method of using twice‐daily observations from polar sensors such as the MODIS and Visible Infrared Imaging Radiometer Suite (VIIRS) to estimate the mid‐morning rise in LST that is used to drive the energy balance estimations within the ALEXI model (Hain et al., 2017). This allows the method to be applied globally using the sensors onboard polar‐orbiting satellites rather than a global composite of all available geostationary data sets. The global ALEXI model ESI product is available at a spatial resolution of 5 km and a period of record from 2001 to 2014, reprocessed to weekly time steps and 25 km resolution for this study.
Читать дальшеИнтервал:
Закладка:
Похожие книги на «Global Drought and Flood»
Представляем Вашему вниманию похожие книги на «Global Drought and Flood» списком для выбора. Мы отобрали схожую по названию и смыслу литературу в надежде предоставить читателям больше вариантов отыскать новые, интересные, ещё непрочитанные произведения.


Обсуждение, отзывы о книге «Global Drought and Flood» и просто собственные мнения читателей. Оставьте ваши комментарии, напишите, что Вы думаете о произведении, его смысле или главных героях. Укажите что конкретно понравилось, а что нет, и почему Вы так считаете.