Global Drought and Flood
Здесь есть возможность читать онлайн «Global Drought and Flood» — ознакомительный отрывок электронной книги совершенно бесплатно, а после прочтения отрывка купить полную версию. В некоторых случаях можно слушать аудио, скачать через торрент в формате fb2 и присутствует краткое содержание. Жанр: unrecognised, на английском языке. Описание произведения, (предисловие) а так же отзывы посетителей доступны на портале библиотеки ЛибКат.
- Название:Global Drought and Flood
- Автор:
- Жанр:
- Год:неизвестен
- ISBN:нет данных
- Рейтинг книги:5 / 5. Голосов: 1
-
Избранное:Добавить в избранное
- Отзывы:
-
Ваша оценка:
Global Drought and Flood: краткое содержание, описание и аннотация
Предлагаем к чтению аннотацию, описание, краткое содержание или предисловие (зависит от того, что написал сам автор книги «Global Drought and Flood»). Если вы не нашли необходимую информацию о книге — напишите в комментариях, мы постараемся отыскать её.
Global Drought and Flood: Observation, Modeling, and Prediction Volume highlights include:
Remote sensing approaches for mapping droughts and floods Physical and statistical models for monitoring and forecasting hydrologic hazards Features of various drought and flood systems and products Use by governments, humanitarian, and development stakeholders in recent disaster cases Improving the collaboration between hazard information provision and end users The American Geophysical Union promotes discovery in Earth and space science for the benefit of humanity. Its publications disseminate scientific knowledge and provide resources for researchers, students, and professionals.
Global Drought and Flood — читать онлайн ознакомительный отрывок
Ниже представлен текст книги, разбитый по страницам. Система сохранения места последней прочитанной страницы, позволяет с удобством читать онлайн бесплатно книгу «Global Drought and Flood», без необходимости каждый раз заново искать на чём Вы остановились. Поставьте закладку, и сможете в любой момент перейти на страницу, на которой закончили чтение.
Интервал:
Закладка:
2.3.4. Evaporative Stress Index
Spatial and temporal variations in instantaneous ET at the continental scale are primarily due to variability in moisture availability (antecedent precipitation), radiative forcing (cloud cover, sun angle), vegetation amount, and local atmospheric conditions such as air temperature, wind speed and vapor pressure deficit. Potential ET describes the evaporation rate expected when soil moisture is nonlimiting, ideally capturing response to all other forcing variables. To isolate effects due to spatially varying soil moisture availability, a simple ESI can be developed from model flux estimates, given by 1 minus the ET/PET ratio following the formulation of the CWSI (Crop Water Stress Index; Idso et al., 1981) and WDI (Water Deficit Index; Moran et al. 1994). Using the ALEXI model, we can derive evaporative stress indices associated with the canopy ( ESI c), the soil surface ( ESI s), and the combined plant–soil system ( ESI ):
(2.24) 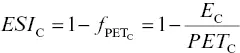
(2.25) 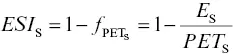
(2.26) 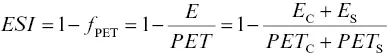
where E C, E S, and E are the modeled actual ET fluxes (mm) from the canopy, soil and system, respectively, and PET C, PET S, PET are potential rates associated with these components (mm). These indices have a value of 0 when there is ample moisture/no stress, and a value of 1 when evapotranspiration has been cut off because of stress‐induced stomatal closure and/or complete drying of the soil surface (Anderson et al., 2007).
2.4. DROUGHT MONITORING PRODUCT SYSTEM BASED ON ET REMOTE SENSING
2.4.1. Theoretical Description of ET and Drought Monitoring Product System
Monitoring ET and the extent and severity of agricultural drought is an important component of food and water security and world crop market assessment. Currently, no spatially distributed land surface ET product is available routinely from satellite observations. The GOES thermal observation based ET product is in high demand by the National Center for Environmental Prediction (NCEP) for validating Noah land surface model output and satellite based drought data product for monthly drought briefing. Moreover, ET/drought information is greatly needed in the U.S. Department of Agriculture (Foreign Agricultural Service/National Agricultural Statistics Service/Agricultural Research Service) for world crop forecasts and United States agricultural production monitoring. Since the GOES data are operationally available within NESDIS, generating ET and drought data products via the ALEXI model will meet the data needs by NCEP groups and other users. Under the circumstances, the GET‐D product system is designed to generate ET and drought maps operationally.
The ALEXI model computes the principle surface energy fluxes, including ET, which is a critical boundary condition to weather and hydrologic modeling, and a quantity required for regional water resource management. The ALEXI model ET estimates have been rigorously evaluated in comparison with ground‐based data, and perform well over a range in climatic and vegetation conditions. Evapotranspiration deficits in comparison with PET rates provide proxy information regarding soil moisture availability. In regions of dense vegetation, ET probes moisture conditions in the plant root zone, down to meter depths. A simple ESI can be developed from the ALEXI model flux estimates. Anderson et al. (2007, 2011) have demonstrated that the ALEXI model ESI over the continental United States shows good correspondence with standard drought metrics and antecedent precipitation, but can be generated at significantly higher spatial resolution due to a limited reliance on ground observations. As a diagnostic indicator of actual ET, accounting for both precipitation and nonprecipitation related inputs to the plant‐available soil moisture pool (e.g., irrigation, shallow groundwater), the ESI is a measure of actual vegetation stress rather than potential for stress. Because precipitation is not used in construction of the ESI, this index provides an independent assessment of drought conditions and will have particular utility for real‐time monitoring in regions with sparse rainfall data or significant delays in meteorological reporting.
2.4.2. GOES ET and Drought Product System Design
The GET‐D system provides a framework of interpreting LST and vegetation index for remote sensing drought signals within the context of a physically based energy balance model, i.e., ALEXI. Using brightness temperature measurements at morning times, and initial estimates of near‐surface temperature, the surface component of the ALEXI model yields instantaneous sensible heat flux estimates (Anderson et al., 1997). A simple SLAB model is used in ALEXI to describe the dynamics of its ABL component. The sensible heat flux estimates from both the surface and ABL components of the ALEXI model are iterated until the time‐integrated sensible heat flux estimates from both components converge. Then the instantaneous satellite‐based flux estimate is extrapolated to daily fluxes by assuming the evaporative fraction is constant during daylight hours for a given day. A simple ESI, which represents anomalies in the remotely sensed ET/PET fraction generated with the ALEXI model flux estimates, is then computed as a drought monitoring tool.
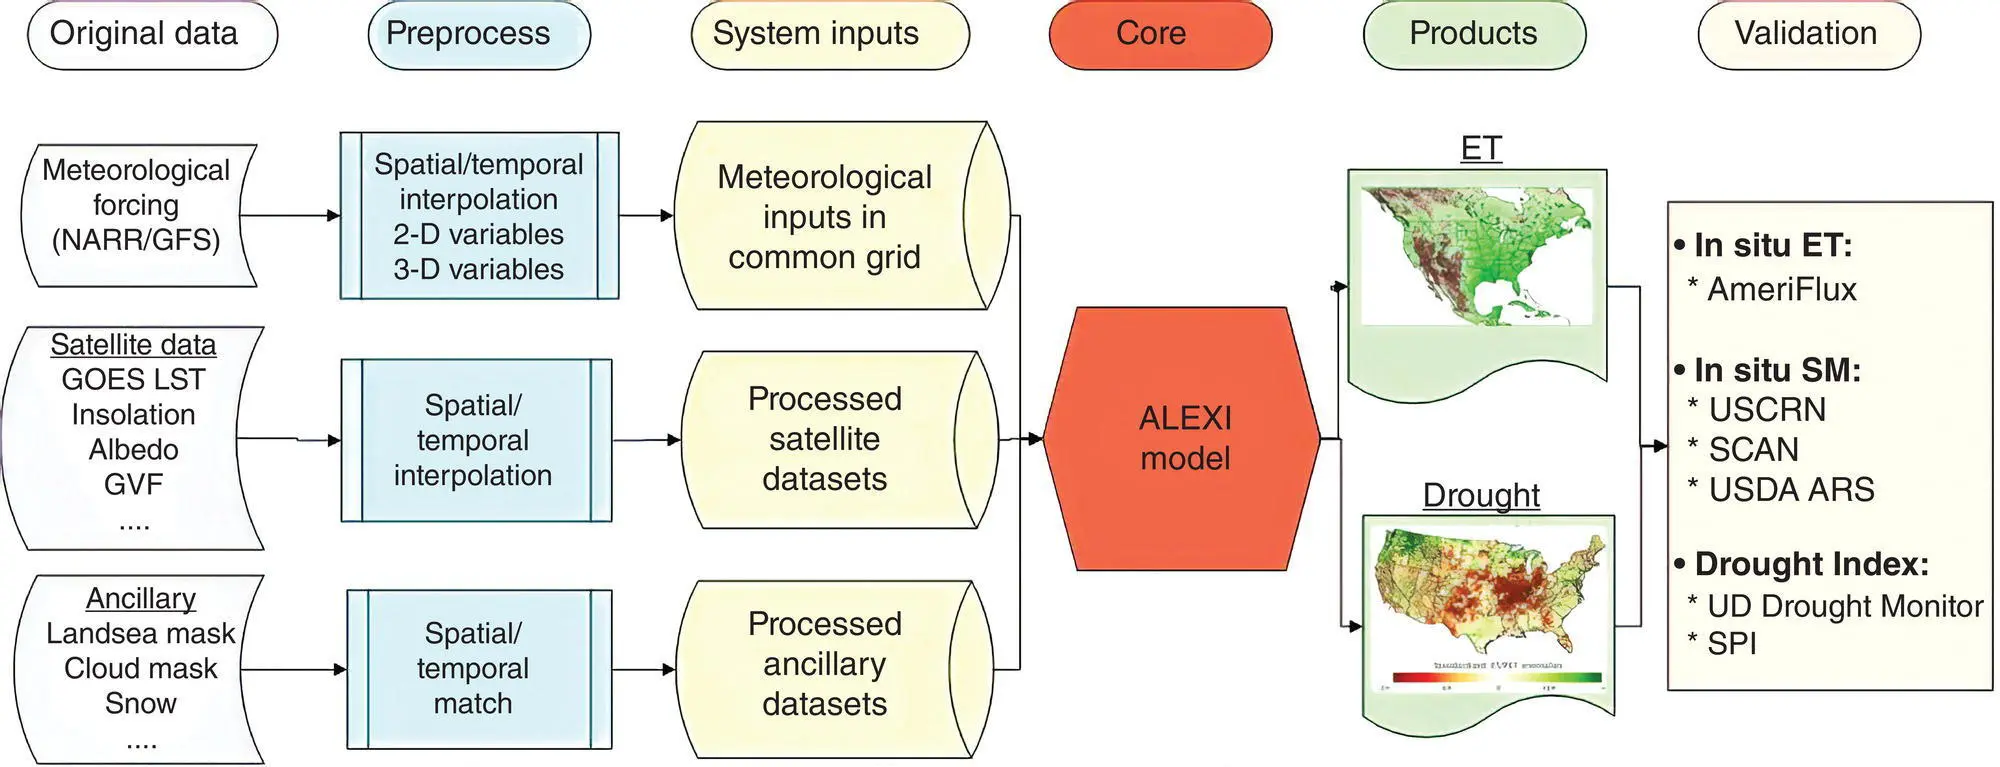
Figure 2.2 The GOES evapotranspiration and drought product (GET‐D) system design: SM, soil moisture.
Table 2.2GET‐D system outputs
| Variables | Source | Spatial domain | Spatial resolution (km) | Description |
|---|---|---|---|---|
| ET product with QC | GET‐D | North America | 8 | Daily ET map |
| ESI products with QC | GET‐D | North America | 8 | 2,4,8, 12‐week composite drought map |
| Flux products with QC | GET‐D | North America | 8 | Daily sensible heat and soil heat flux map |
| Radiance products with QC | GET‐D | North America | 8 | Daily short wave down, long wave down, long wave up and net radiation map |
Figure 2.2shows the design of the GET‐D system. The GET‐D system consists of the following six major modules
1 Meteorological forcing process (MFP) module preprocesses meteorological forcing data and resamples the required forcing variables to the ALEXI model domain.
2 Satellite data sets process (SDP) module preprocesses satellite data including GOES LST, GSIP insolation, vegetation index, cloud mask, and snow mask and resamples the data sets to the ALEXI model domain.
3 Ancillary datasets process (ADP) module preprocesses ancillary data sets including land cover, albedo, and satellite viewing angle.
4 ALEXI module is the core of the GET‐D system that executes the ALEXI model and estimates flux and ET.
5 Quality control flag (QCF) module generates pixel‐based quality control flags for product quality monitoring purposes.
6 Product output (POP) module produces the GET‐D final product in NetCDF, GRIB2 and PNG formats.
Читать дальшеИнтервал:
Закладка:
Похожие книги на «Global Drought and Flood»
Представляем Вашему вниманию похожие книги на «Global Drought and Flood» списком для выбора. Мы отобрали схожую по названию и смыслу литературу в надежде предоставить читателям больше вариантов отыскать новые, интересные, ещё непрочитанные произведения.


Обсуждение, отзывы о книге «Global Drought and Flood» и просто собственные мнения читателей. Оставьте ваши комментарии, напишите, что Вы думаете о произведении, его смысле или главных героях. Укажите что конкретно понравилось, а что нет, и почему Вы так считаете.