Yong Chen - Industrial Data Analytics for Diagnosis and Prognosis
Здесь есть возможность читать онлайн «Yong Chen - Industrial Data Analytics for Diagnosis and Prognosis» — ознакомительный отрывок электронной книги совершенно бесплатно, а после прочтения отрывка купить полную версию. В некоторых случаях можно слушать аудио, скачать через торрент в формате fb2 и присутствует краткое содержание. Жанр: unrecognised, на английском языке. Описание произведения, (предисловие) а так же отзывы посетителей доступны на портале библиотеки ЛибКат.
- Название:Industrial Data Analytics for Diagnosis and Prognosis
- Автор:
- Жанр:
- Год:неизвестен
- ISBN:нет данных
- Рейтинг книги:5 / 5. Голосов: 1
-
Избранное:Добавить в избранное
- Отзывы:
-
Ваша оценка:
Industrial Data Analytics for Diagnosis and Prognosis: краткое содержание, описание и аннотация
Предлагаем к чтению аннотацию, описание, краткое содержание или предисловие (зависит от того, что написал сам автор книги «Industrial Data Analytics for Diagnosis and Prognosis»). Если вы не нашли необходимую информацию о книге — напишите в комментариях, мы постараемся отыскать её.
In
, distinguished engineers Shiyu Zhou and Yong Chen deliver a rigorous and practical introduction to the random effects modeling approach for industrial system diagnosis and prognosis. In the book’s two parts, general statistical concepts and useful theory are described and explained, as are industrial diagnosis and prognosis methods. The accomplished authors describe and model fixed effects, random effects, and variation in univariate and multivariate datasets and cover the application of the random effects approach to diagnosis of variation sources in industrial processes. They offer a detailed performance comparison of different diagnosis methods before moving on to the application of the random effects approach to failure prognosis in industrial processes and systems.
In addition to presenting the joint prognosis model, which integrates the survival regression model with the mixed effects regression model, the book also offers readers:
A thorough introduction to describing variation of industrial data, including univariate and multivariate random variables and probability distributions Rigorous treatments of the diagnosis of variation sources using PCA pattern matching and the random effects model An exploration of extended mixed effects model, including mixture prior and Kalman filtering approach, for real time prognosis A detailed presentation of Gaussian process model as a flexible approach for the prediction of temporal degradation signals Ideal for senior year undergraduate students and postgraduate students in industrial, manufacturing, mechanical, and electrical engineering,
is also an indispensable guide for researchers and engineers interested in data analytics methods for system diagnosis and prognosis.
Industrial Data Analytics for Diagnosis and Prognosis — читать онлайн ознакомительный отрывок
Ниже представлен текст книги, разбитый по страницам. Система сохранения места последней прочитанной страницы, позволяет с удобством читать онлайн бесплатно книгу «Industrial Data Analytics for Diagnosis and Prognosis», без необходимости каждый раз заново искать на чём Вы остановились. Поставьте закладку, и сможете в любой момент перейти на страницу, на которой закончили чтение.
Интервал:
Закладка:
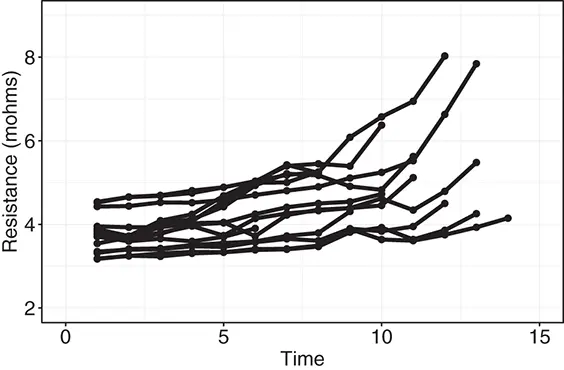
Figure 1.3 Internal resistance measures from multiple batteries over time.
We can clearly see from Figure 1.3 that although similar, the progression paths of the internal resistance over time of different batteries are not identical. The difference is certainly expected due to many random factors in the material, manufacturing processes, and the working environment that vary from unit-to-unit. The random characteristics of degradation paths are random effects, which impact the observed degradation signals of multiple batteries.
The available data from multiple similar units/machines poses interesting intellectual opportunities and challenges for prognosis. As for opportunities, since we have observations from potentially a very large number of similar units, we can compare their operations/conditions, share the information, and extract common knowledge to enable accurate prediction and control at the individual level. As for challenges, because the data are collected in the field and not in a controlled environment, the data contain significant variation and heterogeneity due to the large variations in working conditions for different units. The data analytics approaches should not only be general (so that the common information can be learned and shared), but also flexible (so that the behavior of an individual subject can be captured and controlled).
Random effects always exist in industrial processes. The process variation caused by random effects is detrimental and thus random effects should be modeled, analyzed, and controlled, particularly in system diagnosis and prognosis. However, due to the limitation in the data availability, the data analytics approaches considering random effects have not been widely adopted in industrial practices. Indeed, before the significant advancement in communication and information technology, data collection in industries often occurs locally in very similar environments. With such limited data, the impact of random effects cannot be exposed and modeled easily. This situation has changed significantly in recent years due to the digital revolution as mentioned at the beginning of the section.
The statistical methods for random effects provide a powerful set of tools for us to model and analyze the random variation in an industrial process. The goal of this book is to provide a textbook for engineering students and a reference book for researchers and industrial practitioners to adapt and bring the theory and techniques of random effects to the application area of industrial system diagnosis and prognosis. The detailed scope of the book is summarized in the next section.
1.2 Scope and Organization of the Book
This book focuses on industrial data analytics methods for system diagnosis and prognosis with an emphasis on random effects in the system. Diagnosis concerns identification of the root cause of a failure or an abnormal working condition. In the context of random effects, the goal of diagnosis is to identify the variation sources in the system. Prognosis concerns using data to predict what will happen in the future. Regarding random effects, prognosis focuses on addressing unit-to-unit variation and making degradation/failure predictions for each individual unit considering the unique characteristic of the unit.
The book contains two main parts:
1 Statistical Methods and Foundation for Industrial Data AnalyticsThis part covers general statistical concepts, methods, and theory useful for describing and modelling the variation, the fixed effects, and the random effects for both univariate and multivariate data. This part provides necessary background for later chapters in part II. In part I, Chapter 2introduces the basic statistical methods for visualizing and describing data variation. Chapter 3introduces the concept of random vectors and multivariate normal distribution. Basic concepts in statistical modeling and inference will also be introduced. Chapter 4 focuses on the principal component analysis (PCA) method. PCA is a powerful method to expose and describe the variations in multivariate data. PCA has broad applications in variation source identification. Chapter 5 focuses on linear regression models, which are useful in modeling the fixed effects in a dataset. Statistical inference in linear regression including parameter estimation and hypothesis testing approaches will be discussed. Chapter 6 focuses on the basic theory of the linear mixed effects model, which captures both the fixed effects and the random effects in the data.
2 Random Effects Approaches for Diagnosis and PrognosisThis part covers the applications of the random effects modeling approach to diagnosis of variation sources and to failure prognosis in industrial processes/systems. Through industrial application examples, we will present variation pattern based variation source identification in Chapter 7. Variation source estimation methods based on the linear mixed effects model will be introduced in Chapter 8. A detailed performance comparison of different methods for practical applications is presented as well. In Chapter 9, the diagnosability issue for the variation source diagnosis problem will be studied. Chapter 10 introduces the mixed effects longitudinal modeling approach for forecasting system degradation and predicting remaining useful life based on the first time hitting probability. Some variations of the basic method such as the method considering mixture prior for unbalanced data in remaining useful life prediction are also presented. Chapter 11 introduces the concept of Gaussian processes as a nonparametric way for the modeling and analysis of multiple longitudinal signals. The application of the multi-output Gaussian process for failure prognosis will be presented as well. Chapter 12 introduces the method for failure prognosis combining the degradation signals and time-to-event data. The advanced joint prognosis model which integrates the survival regression model and the mixed effects regression model is presented.
1.3 How to Use This Book
This book is intended for students, engineers, and researchers who are interested in using modern statistical methods for variation modeling, diagnosis, and prediction in industrial systems.
This book can be used as a textbook for a graduate level or advanced undergraduate level courses on industrial data analytics. The book is fairly self-contained, although background in basic probability and statistics such as the concept of random variable, probability distribution, moments, and basic knowledge in linear algebra such as matrix operations and matrix decomposition would be useful. The appendix at the end of the book provides a summary of the necessary concepts and results in linear space and matrix theory. The materials in Part II of the book are relatively independent. So the instructor could combine selected chapters in Part II with Part I as the basic materials for different courses. For example, topics in Part I can be used for an advanced undergraduate level course on introduction to industrial data analytics. The materials in Part I and some selected chapters in Part II (e.g., Chapters 7, 8, and 9) can be used in a master’s level statistical quality control course. Similarly, materials in Part I and selected later chapters in Part II (e.g., Chapters 10, 11, 12) can be used in a master’s level course with emphasis on prognosis and reliability applications. Finally, Part II alone can be used as the textbook for an advanced graduate level course on diagnosis and prognosis.
One important feature of this book is that we provide detailed descriptions of software implementation for most of the methods and algorithms. We adopt the statistical programming language R in this book. R language is versatile and has a very large number of up-to-date packages implementing various statistical methods [R Core Team, 2020]. This feature makes this book fit well with the needs of practitioners in engineering fields to self study and implement the statistical modeling and analysis methods. All the R codes and data sets used in this book can be found at the book companion website.
Читать дальшеИнтервал:
Закладка:
Похожие книги на «Industrial Data Analytics for Diagnosis and Prognosis»
Представляем Вашему вниманию похожие книги на «Industrial Data Analytics for Diagnosis and Prognosis» списком для выбора. Мы отобрали схожую по названию и смыслу литературу в надежде предоставить читателям больше вариантов отыскать новые, интересные, ещё непрочитанные произведения.


Обсуждение, отзывы о книге «Industrial Data Analytics for Diagnosis and Prognosis» и просто собственные мнения читателей. Оставьте ваши комментарии, напишите, что Вы думаете о произведении, его смысле или главных героях. Укажите что конкретно понравилось, а что нет, и почему Вы так считаете.