Yong Chen - Industrial Data Analytics for Diagnosis and Prognosis
Здесь есть возможность читать онлайн «Yong Chen - Industrial Data Analytics for Diagnosis and Prognosis» — ознакомительный отрывок электронной книги совершенно бесплатно, а после прочтения отрывка купить полную версию. В некоторых случаях можно слушать аудио, скачать через торрент в формате fb2 и присутствует краткое содержание. Жанр: unrecognised, на английском языке. Описание произведения, (предисловие) а так же отзывы посетителей доступны на портале библиотеки ЛибКат.
- Название:Industrial Data Analytics for Diagnosis and Prognosis
- Автор:
- Жанр:
- Год:неизвестен
- ISBN:нет данных
- Рейтинг книги:5 / 5. Голосов: 1
-
Избранное:Добавить в избранное
- Отзывы:
-
Ваша оценка:
Industrial Data Analytics for Diagnosis and Prognosis: краткое содержание, описание и аннотация
Предлагаем к чтению аннотацию, описание, краткое содержание или предисловие (зависит от того, что написал сам автор книги «Industrial Data Analytics for Diagnosis and Prognosis»). Если вы не нашли необходимую информацию о книге — напишите в комментариях, мы постараемся отыскать её.
In
, distinguished engineers Shiyu Zhou and Yong Chen deliver a rigorous and practical introduction to the random effects modeling approach for industrial system diagnosis and prognosis. In the book’s two parts, general statistical concepts and useful theory are described and explained, as are industrial diagnosis and prognosis methods. The accomplished authors describe and model fixed effects, random effects, and variation in univariate and multivariate datasets and cover the application of the random effects approach to diagnosis of variation sources in industrial processes. They offer a detailed performance comparison of different diagnosis methods before moving on to the application of the random effects approach to failure prognosis in industrial processes and systems.
In addition to presenting the joint prognosis model, which integrates the survival regression model with the mixed effects regression model, the book also offers readers:
A thorough introduction to describing variation of industrial data, including univariate and multivariate random variables and probability distributions Rigorous treatments of the diagnosis of variation sources using PCA pattern matching and the random effects model An exploration of extended mixed effects model, including mixture prior and Kalman filtering approach, for real time prognosis A detailed presentation of Gaussian process model as a flexible approach for the prediction of temporal degradation signals Ideal for senior year undergraduate students and postgraduate students in industrial, manufacturing, mechanical, and electrical engineering,
is also an indispensable guide for researchers and engineers interested in data analytics methods for system diagnosis and prognosis.
Industrial Data Analytics for Diagnosis and Prognosis — читать онлайн ознакомительный отрывок
Ниже представлен текст книги, разбитый по страницам. Система сохранения места последней прочитанной страницы, позволяет с удобством читать онлайн бесплатно книгу «Industrial Data Analytics for Diagnosis and Prognosis», без необходимости каждый раз заново искать на чём Вы остановились. Поставьте закладку, и сможете в любой момент перейти на страницу, на которой закончили чтение.
Интервал:
Закладка:
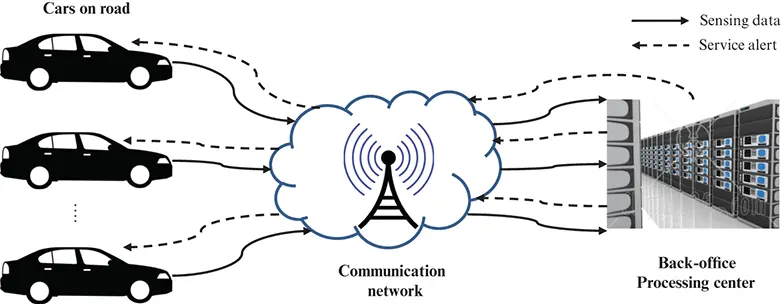
Figure 1.1 A diagram of an IoT enabled remote condition monitoring system.
The unprecedented data availability provides great opportunities for more precise and contextualized system condition monitoring, diagnosis, and prognosis, which are very challenging to achieve if only scarce data are available. Industrial data analytics is the process of collecting, exploring, and analyzing data generated from industrial operations throughout the product life cycle in order to gain insights and improve decision-making. Industrial data analytics encompasses a vast set of applied statistics and machine learning tools and techniques, including data visualization, data-driven process modeling, statistical process monitoring, root cause identification and diagnosis, predictive analytics, system reliability and robustness, and design of experiments, to name just a few. The focus of this book is industrial data analytics approaches that can take advantage of the unprecedented data availability. Particularly, we focus on the concept of random effects and its applications in system diagnosis and prognosis.
The terms diagnosis and prognosis were originally used in the medical field. Diagnosis is the identification of the disease that is responsible to the symptoms of the patient’s illness, and prognosis is a forecast of the likely course of the disease. In the field of engineering, these terms have similar meanings: for an industrial system, diagnosis is the identification of the root cause of a system failure or abnormal working condition; and prognosis is the prediction of the system degradation status and the future failure or break down. Obviously, diagnosis and prognosis play a critical role in assuring smooth, efficient, and safe system operations. Indeed, diagnosis and prognosis have attracted ever-growing interest in recent years. This trend has been driven by the fact that capital goods manufacturers have been coming under increasing pressure to open up new sources of revenue and profit in recent years. Maintenance service costs constitute around 60–90% of the life-cycle costs of industrial machinery and installations. Systematic extension of the after-sales service business will be an increasingly important driver of profitable growth.
Due to the importance of diagnosis and prognosis in industrial system operations, a relatively large number of books/research monographs exist on this topic [Lewis et al., 2011, Niu, 2017, Wu et al., 2006, Talebi et al., 2009, Gertler, 1998, Chen and Patton, 2012, Witczak, 2007, Isermann, 2011, Ding, 2008, Si et al., 2017]. As implied by their titles, many of these books focus on model-based diagnosis and prognosis problems in dynamic systems. A model-based approach adopts a dynamic model, often in the form of a state space model, as the basis for diagnosis and prognosis. Then the difference between the observations and the model predictions, called residuals, are examined to achieve fault identification and diagnosis. For the prognosis, data-driven dynamic forecasting methods, such as time series modeling methods, are used to predict the future values of the interested system signals. The modeling and analysis of the system dynamics are the focus of the existing literature.
Different from the existing literature, this book focuses on the concept of random effects and its applications in system diagnosis and prognosis . Random effects, as the name implies, refer to the underlying random factors in an industrial process that impact on the outcome of the process. In diagnosis and prognosis applications, random effects can be used to model the sources of variation in a process and the variation among individual characteristics of multiple heterogeneous units. The following two examples illustrate the random effects in industrial processes.
Example 1.1Random effects in automotive body sheet metal assembly processes
The concept of variation source is illustrated for an assembly operation in which two parts are welded together. In an automotive sheet metal assembly process, the sheet metals will be positioned and clamped on the fixture system through the matching of the locators (also called pins) on the fixture system and the holes on the sheet metals. Then the sheet metals will be welded together. Clearly, the accuracy of the positions of the locating pins and the tightness of the matching between the pins and the holes significantly influence the dimensional accuracy of the final assembly. Figure 1.2(a) shows the final product as designed. The assembly process is as follows: Part 1 is first located on the fixture and constrained by 4-way Pin L 1and 2-way Pin L 2. A 4-way pin constrains the movement in two directions, while a 2-way pin only constrains the movement in one direction. Then, Part 2 is located by 4-way Pin L 3and 2-way Pin L 4. The two parts are then welded together in a joining operation and released from the fixture.
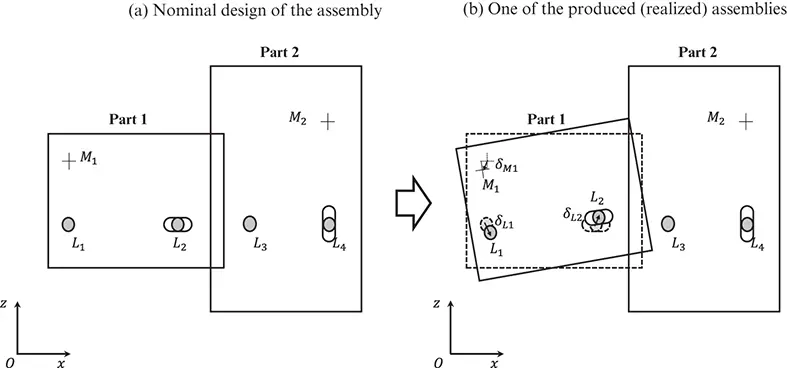
Figure 1.2 Random effects in an assembly operation.
If the position or diameter of Pin L 1deviates from design nominal, then Part 1 will consequently not be in its designed nominal position, as shown in Figure 1.2(b). After joining Part 1 and Part 2, the dimensions of the final parts will deviate from the designed nominal values. One critical point that needs to be emphasized is that Figure 1.2(b) only shows one possible realization of produced assemblies. If we produce another assembly, the deviation of the position of Part 1 could be different. For instance, if the diameter of a pin is reduced due to pin wear, then the matching between the pin and the corresponding hole will be loose, which will lead to random wobble of the final position of part. This will in turn cause increased variation in the dimension of the produced final assemblies. As a result, mislocations of the pin can be manifested by either mean shift or variance change in the dimensional quality measurement such as M 1and M 2in the figure. In the case of mean shift error (for example due to a fixed position shift of the pin), the error can be compensated by process adjustment such as realignment of the locators. The variance change errors (for example due to a worn-out pin or the excessive looseness of a pin) cannot be easily compensated for in most cases. Also, note that each locator in the process is a potential source of the variance change errors, which is referred to as a variation source . The variation sources are random effects in the process that will impact on the final assembly quality. In most assembly processes, the pin wear is difficult to measure so the random effects are not directly observed. In a modern automotive body assembly process, hundreds of locators are used to position a large number of parts and sub-assemblies. An important and challenging diagnosis problem is to estimate and identify the variation sources in the process based on the observed quality measurements.
Example 1.2Random effects in battery degradation processes
In industrial applications, the reliability of a critical unit is crucial to guarantee the overall functional capabilities of the entire system. Failure of such a unit can be catastrophic. Turbine engines of airplanes, power supplies of computers, and batteries of automobiles are typical examples where failure of the unit would lead to breakdown of the entire system. For these reasons, the working condition of such critical units must be monitored and the remaining useful life (RUL) of such units should be predicted so that we can take preventive actions before catastrophic failure occurs. Many system failure mechanisms can be traced back to some underlying degradation processes. An important prognosis problem is to predict RUL based on the degradation signals collected, which are often strongly associated with the failure of the unit. For example, Figure 1.3 shows the evolution of the internal resistance signals of multiple automotive lead-acid batteries. The internal resistance measurement is known to be one of the best condition monitoring signals for the battery life prognosis [Eddahech et al., 2012]. As we can see from Figure 1.3, the internal resistance measurement generally increases with the service time of the battery, which indicates that the health status of the battery is deteriorating.
Читать дальшеИнтервал:
Закладка:
Похожие книги на «Industrial Data Analytics for Diagnosis and Prognosis»
Представляем Вашему вниманию похожие книги на «Industrial Data Analytics for Diagnosis and Prognosis» списком для выбора. Мы отобрали схожую по названию и смыслу литературу в надежде предоставить читателям больше вариантов отыскать новые, интересные, ещё непрочитанные произведения.


Обсуждение, отзывы о книге «Industrial Data Analytics for Diagnosis and Prognosis» и просто собственные мнения читателей. Оставьте ваши комментарии, напишите, что Вы думаете о произведении, его смысле или главных героях. Укажите что конкретно понравилось, а что нет, и почему Вы так считаете.