Ibrahim Dincer - Thermal Energy Storage Systems and Applications
Здесь есть возможность читать онлайн «Ibrahim Dincer - Thermal Energy Storage Systems and Applications» — ознакомительный отрывок электронной книги совершенно бесплатно, а после прочтения отрывка купить полную версию. В некоторых случаях можно слушать аудио, скачать через торрент в формате fb2 и присутствует краткое содержание. Жанр: unrecognised, на английском языке. Описание произведения, (предисловие) а так же отзывы посетителей доступны на портале библиотеки ЛибКат.
- Название:Thermal Energy Storage Systems and Applications
- Автор:
- Жанр:
- Год:неизвестен
- ISBN:нет данных
- Рейтинг книги:4 / 5. Голосов: 1
-
Избранное:Добавить в избранное
- Отзывы:
-
Ваша оценка:
Thermal Energy Storage Systems and Applications: краткое содержание, описание и аннотация
Предлагаем к чтению аннотацию, описание, краткое содержание или предисловие (зависит от того, что написал сам автор книги «Thermal Energy Storage Systems and Applications»). Если вы не нашли необходимую информацию о книге — напишите в комментариях, мы постараемся отыскать её.
Provides students and engineers with up-to-date information on methods, models, and approaches in thermal energy storage systems and their applications in thermal management and elsewhere Thermal Energy Storage: Systems and Applications
Thermal Energy Storage: Systems and Applications, Third Edition
Thermal Energy Storage Systems and Applications — читать онлайн ознакомительный отрывок
Ниже представлен текст книги, разбитый по страницам. Система сохранения места последней прочитанной страницы, позволяет с удобством читать онлайн бесплатно книгу «Thermal Energy Storage Systems and Applications», без необходимости каждый раз заново искать на чём Вы остановились. Поставьте закладку, и сможете в любой момент перейти на страницу, на которой закончили чтение.
Интервал:
Закладка:
(1.79) 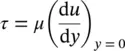
which varies with distance along the plate by the change in velocity. Further along the plate, the shear force is gradually increased, as the laminar boundary layer thickens, because of the increasing plate surface area affected, and the fluid becomes retarded, so that a turbulent boundary layer occurs as instabilities set in. Thus, the shear stress for the turbulent flow can be approximated as
(1.80) 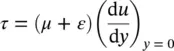
Experimental studies indicate that there are two boundary layer flow regimes; a laminar flow regime and a turbulent flow regime , which can be characterized by the Reynolds number, as pointed out earlier. The transition from a laminar to a turbulent boundary layer is dependent mainly upon the following:
Re = usxc/v;
the roughness of the plate; and
the turbulence level in the free stream.
There are various boundary‐layer parameters to be considered, such as boundary‐layer thickness, the local wall shear stress (or local friction or drag coefficient), and the average wall shear stress (or average friction or drag coefficient). The boundary‐layer thickness may be expressed in several ways. The simplest approach is that the velocity u within the boundary layer approaches the free‐stream velocity u s. From experimental measurements, it was observed that the boundary‐layer thickness δ can be defined as the distance from the boundary to the point at which u = 0.99 u s.
Table 1.6gives the values of the boundary‐layer thicknesses for laminar flow along a flat plate as a function of dimensionless coordinates η = y ( u s/ vx ). These values are of practical interest in momentum analysis of fluid flow.
The momentum equations for velocity profiles can be summarized with respect to the momentum thickness, the average skin‐drag coefficient, and the displacement thickness (see Table 1.7for a flat plate). As can be pointed out from the table, the laminar boundary‐layer thickness increases with x 1/2from the leading edge and inversely with  , the local and average skin‐drag coefficients change inversely with x 1/2and , and the total drag force,
 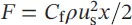 per unit width, changes as the 1.5 power of u sand the square root of the length x . Normally, fluid flow along a flat plate is laminar for Reynolds number values up to about 300 000–500 000, depending on the plate roughness and the level of turbulence in the free stream, as mentioned earlier.
Table 1.6 Values of laminar boundary‐layer thicknesses for laminar flow over a flat plate.
Source: Olson and Wright [8].
| η | 0.0 | 0.6 | 1.2 | 1.8 | 2.4 | 3.0 | 3.6 | 4.2 | 4.8 | 5.4 | 6.0 |
| δ | 0.000 | 0.200 | 0.394 | 0.575 | 0.729 | 0.846 | 0.924 | 0.967 | 0.988 | 0.996 | 0.999 |
Table 1.7 Momentum equations for laminar boundary layer.
Source: Olson and Wright [8].
| Velocity profile | δ / x | C f | δ * / x |
|---|---|---|---|
| u / u s= y / δ |  |
 |
 |
| u / u s= 2( y / δ ) − ( y / δ ) 2 |  |
 |
 |
| u / u s= 1.5( y / δ ) − 0.5( y / δ ) 3 |  |
 |
 |
| u / u s= sin π y /2 δ |  |
 |
 |
| Blasius exact solution |  |
 |
 |
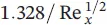
Table 1.8 Momentum equations for a turbulent boundary layer for flat plate flow and for pipe flow.
Source: Olson and Wright [8].
| Re D | F | u / u s | V / u s | C f | Re x |
|---|---|---|---|---|---|
| <10 5 | 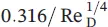 |
( y / R ) 1/7 | 49/60 | 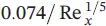 |
5 × 10 5− 10 7 |
| 10 4− 10 6 | 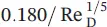 |
( y / R ) 1/8 | 128/153 | 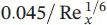 |
1.8 × 10 5− 4.5 × 10 7 |
| 10 5− 10 7 | 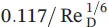 |
( y / R ) 1/10 | 200/231 | 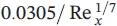 |
2.9 × 10 6− 5 × 10 8 |
Table 1.8presents additional momentum equations for a boundary turbulent layer along a flat plate, including additional pipe flow velocity profiles, and summarizes the following for a turbulent boundary layer on a flat plate:
Читать дальшеИнтервал:
Закладка:
Похожие книги на «Thermal Energy Storage Systems and Applications»
Представляем Вашему вниманию похожие книги на «Thermal Energy Storage Systems and Applications» списком для выбора. Мы отобрали схожую по названию и смыслу литературу в надежде предоставить читателям больше вариантов отыскать новые, интересные, ещё непрочитанные произведения.


Обсуждение, отзывы о книге «Thermal Energy Storage Systems and Applications» и просто собственные мнения читателей. Оставьте ваши комментарии, напишите, что Вы думаете о произведении, его смысле или главных героях. Укажите что конкретно понравилось, а что нет, и почему Вы так считаете.