Diatom Morphogenesis
Здесь есть возможность читать онлайн «Diatom Morphogenesis» — ознакомительный отрывок электронной книги совершенно бесплатно, а после прочтения отрывка купить полную версию. В некоторых случаях можно слушать аудио, скачать через торрент в формате fb2 и присутствует краткое содержание. Жанр: unrecognised, на английском языке. Описание произведения, (предисловие) а так же отзывы посетителей доступны на портале библиотеки ЛибКат.
- Название:Diatom Morphogenesis
- Автор:
- Жанр:
- Год:неизвестен
- ISBN:нет данных
- Рейтинг книги:5 / 5. Голосов: 1
-
Избранное:Добавить в избранное
- Отзывы:
-
Ваша оценка:
Diatom Morphogenesis: краткое содержание, описание и аннотация
Предлагаем к чтению аннотацию, описание, краткое содержание или предисловие (зависит от того, что написал сам автор книги «Diatom Morphogenesis»). Если вы не нашли необходимую информацию о книге — напишите в комментариях, мы постараемся отыскать её.
A unique book presenting the range of silica structures formed by diatoms, theories and hypotheses of how they are made, and applications to nanotechnology by use or imitation of diatom morphogenesis.
Audience
Diatom Morphogenesis — читать онлайн ознакомительный отрывок
Ниже представлен текст книги, разбитый по страницам. Система сохранения места последней прочитанной страницы, позволяет с удобством читать онлайн бесплатно книгу «Diatom Morphogenesis», без необходимости каждый раз заново искать на чём Вы остановились. Поставьте закладку, и сможете в любой момент перейти на страницу, на которой закончили чтение.
Интервал:
Закладка:
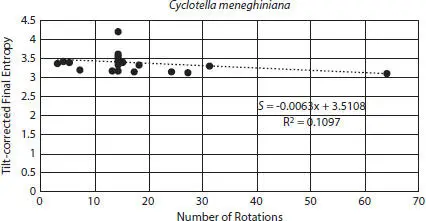
Figure 2.9Number of rotations vs. tilt-corrected final entropies for Cyclotella meneghiniana external valves using 3 to 64 rotations.
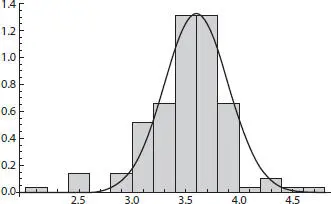
Figure 2.10Histogram and overlain probability density function for all tilt-corrected final entropies resulting in a Gaussian distribution.
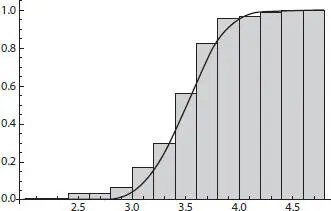
Figure 2.11Histogram and overlain cumulative density function for all tilt-corrected final entropies.
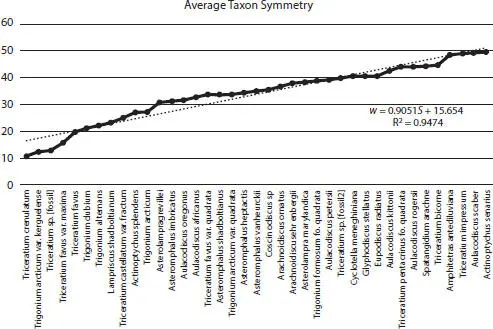
Figure 2.12For all images, average symmetry per taxon ranging from Triceratium crenulatum with the lowest symmetry to Actinoptychus senarius with the highest symmetry.
Valve formation simulation for the eight taxa was plotted against symmetry, and the resultant curves were exponential depicting the change in symmetry from annulus to valve margin (Figure 2.19). The plot includes a second Arachnoidiscus ehrenbergii external valve and a forming valve of this taxon. For valve formation simulation, the distribution of average entropy values was depicted in a histogram and overlain PDF (Figure 2.20) as a gamma distribution and is a maximum entropy distribution. A histogram and overlain CDF of average entropy values were also constructed (Figure 2.21). Standardizing the PDF produced a skewed-right normal prior probability distribution (Figure 2.22), establishing the relation between available information and its probability of occurrence. The prior distribution is also a maximum entropy distribution as a minimization of prior information given via the PDF.
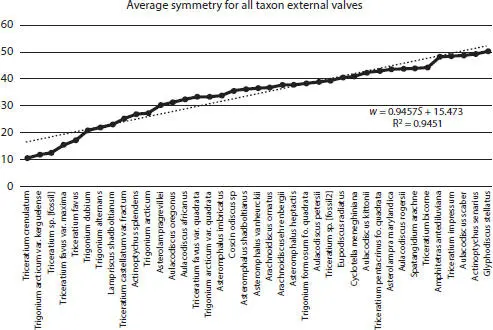
Figure 2.13Average taxon symmetry for all external centric diatom valves ranging from Triceratium crenulatum with the lowest symmetry to Glyphodiscus stellatus with the highest symmetry.
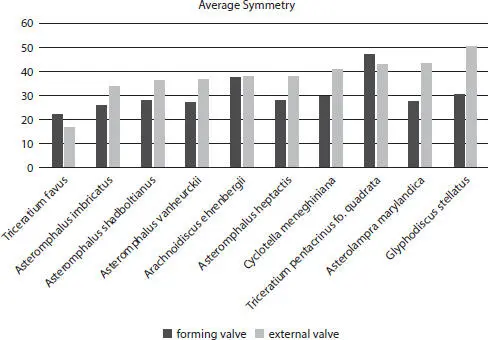
Figure 2.14Vertical valve formation comparison: average external and forming valve symmetry for ten centric diatoms.
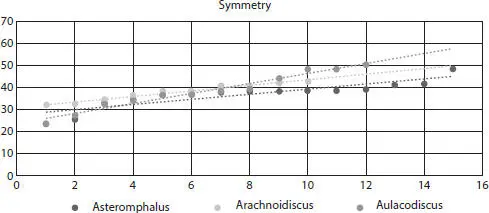
Figure 2.15Symmetry values for Asteromphalus, Arachnoidiscus , and Aulacodiscus external valves.
2.3.2 Valve Formation—Stability and Instability Analyses
Stability analysis was performed using symmetries calculated from the valve formation simulation of cumulative concentric rings from annulus to valve margin for eight taxa. Lyapunov exponents were calculated to determine the behavior of symmetry changes. Initial conditions for valve formation are v Valve formation(0) = v annulus. Each valve formation simulation produced a series of Lyapunov exponents comprising a Lyapunov spectrum [2.166]. The largest real Lyapunov exponent was positive and characterized the overriding behavior of symmetry changes during valve formation. For all taxa, sum of the positive Lyapunov exponents signified chaotic asymmetric behavior characterizing instability ( Table 2.2). The remainder of the real Lyapunov exponents in descending order were very small (large negative values), summed, and signified stability ( Table 2.2). For Lyapunov exponents calculated from KS entropy, some random instability was present during valve simulation as well ( Table 2.2).
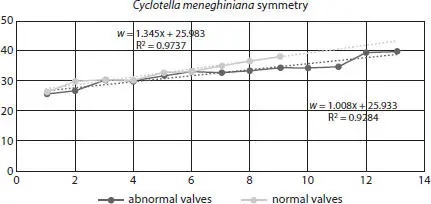
Figure 2.16 Cyclotella meneghiniana symmetry for normal and abnormal valves.
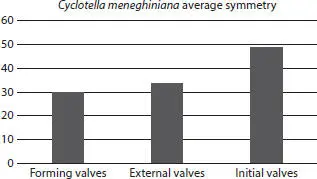
Figure 2.17 Cyclotella meneghiniana symmetry values for normal forming and external vegetative and initial valves.
The change in symmetry was compared with the change in chaotic instability for taxa used in the valve formation simulation. Symmetry increased monotonically in the order of least symmetric to most symmetric: Actinoptychus splendens, Cyclotella meneghiniana, Arachnoidiscus ornatus, Aulacodiscus oregonus, Coscinodiscus sp., Arachnoidiscus ehrenbergii (1), Arachnoidiscus ehrenbergii forming valve, Asterolampra marylandica, Arachnoidiscus ehrenbergii (2), and Actinoptychus senarius ( Table 2.2). Rescaling symmetry and chaotic instability values, a comparative bar graph showed that chaotic instability was more evident in less symmetric taxa Actinoptychus splendens, Cyclotella meneghiniana , Arachnoidiscus ornatus , and Aulacodiscus oregonus than higher symmetric taxa with the exception of Arachnoidiscus ehrenbergii (2) (Figure 2.23). Rescaled random instability was more evident in less symmetric taxa Actinoptychus splendens, Cyclotella meneghiniana , and Aulacodiscus oregonus as well, in contrast to higher symmetric taxa, with the exception of the Arachnoidiscus ehrenbergii forming valve (Figure 2.24). Overall, less symmetry is associated with higher chaotic and random instability (Figures 2.23 and 2.24).
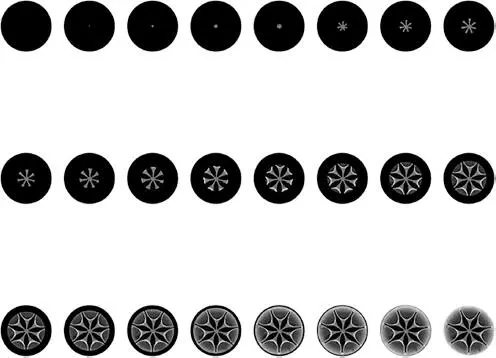
Figure 2.18 Asterolampra marylandica (SanDBay02_03dx1100) as a sequence of 24 cumulative concentric rings simulating valve formation from annulus to valve margin.
2.4 Discussion
From average symmetry per taxon for all valves, triangular and non-regular structured surface circular taxa exhibited less symmetry than highly regularly structured circular and four-edged or greater polygonal taxa (Figure 2.12). By inspection, the result is evident, and the method of using entropy to determine symmetry states has explicit utility. Additionally, although we measured rotational symmetry, other symmetries are present as well (Figure 2.3). Separate tests for each type of symmetry could be made, and quantification of each type of symmetry would need to be instituted to determine the contribution of a particular symmetry throughout centric diatom development.
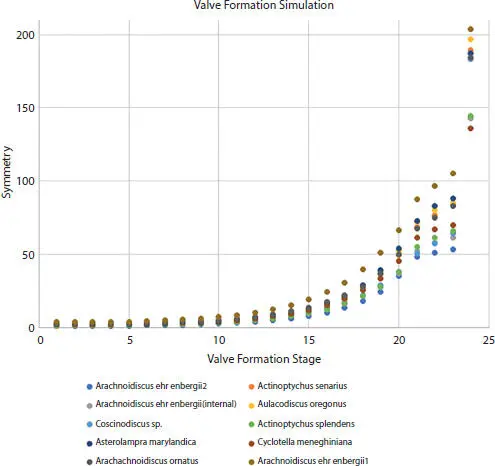
Figure 2.19Plots of symmetry vs. 24-valve formation simulation steps from annulus to valve margin for eight centric diatom taxa. Order from least to highest symmetry curve per taxon is read left to right in legend. Symmetry increases exponentially from the annulus to the completed valve.
Читать дальшеИнтервал:
Закладка:
Похожие книги на «Diatom Morphogenesis»
Представляем Вашему вниманию похожие книги на «Diatom Morphogenesis» списком для выбора. Мы отобрали схожую по названию и смыслу литературу в надежде предоставить читателям больше вариантов отыскать новые, интересные, ещё непрочитанные произведения.


Обсуждение, отзывы о книге «Diatom Morphogenesis» и просто собственные мнения читателей. Оставьте ваши комментарии, напишите, что Вы думаете о произведении, его смысле или главных героях. Укажите что конкретно понравилось, а что нет, и почему Вы так считаете.