Diatom Morphogenesis
Здесь есть возможность читать онлайн «Diatom Morphogenesis» — ознакомительный отрывок электронной книги совершенно бесплатно, а после прочтения отрывка купить полную версию. В некоторых случаях можно слушать аудио, скачать через торрент в формате fb2 и присутствует краткое содержание. Жанр: unrecognised, на английском языке. Описание произведения, (предисловие) а так же отзывы посетителей доступны на портале библиотеки ЛибКат.
- Название:Diatom Morphogenesis
- Автор:
- Жанр:
- Год:неизвестен
- ISBN:нет данных
- Рейтинг книги:5 / 5. Голосов: 1
-
Избранное:Добавить в избранное
- Отзывы:
-
Ваша оценка:
Diatom Morphogenesis: краткое содержание, описание и аннотация
Предлагаем к чтению аннотацию, описание, краткое содержание или предисловие (зависит от того, что написал сам автор книги «Diatom Morphogenesis»). Если вы не нашли необходимую информацию о книге — напишите в комментариях, мы постараемся отыскать её.
A unique book presenting the range of silica structures formed by diatoms, theories and hypotheses of how they are made, and applications to nanotechnology by use or imitation of diatom morphogenesis.
Audience
Diatom Morphogenesis — читать онлайн ознакомительный отрывок
Ниже представлен текст книги, разбитый по страницам. Система сохранения места последней прочитанной страницы, позволяет с удобством читать онлайн бесплатно книгу «Diatom Morphogenesis», без необходимости каждый раз заново искать на чём Вы остановились. Поставьте закладку, и сможете в любой момент перейти на страницу, на которой закончили чтение.
Интервал:
Закладка:
2.3 Results
2.3.1 Symmetry Analysis
For analysis, 151 centric diatom images (Figure 2.6a) were background masked, rotated, and overlain to calculate entropy values using the equation for Boltzmann entropy. From this, 94 external valves and 19 forming valves, along with Cyclotella meneghiniana valves: 12 replicates of SClemtbx1800, 13 abnormal valves, 6 forming valves, and 2 initial valves. Entropy filtering applied to the original images enabled detection of those structures that contribute to the measurement of symmetry (Figure 2.6b). Tilt and slant were calculated for each image. Tilt ranged from 0.725 to 0.785, and slant ranged from 1.392 to 1.496° for all images. Tilt correction was applied to each image (Figures 2.6c, d), and slant was corrected via rotation. All initial entropy values were tilt-corrected via tilt entropy to produce final entropy values.
For each image, final entropy (hereafter simply called “entropy”) values were plotted against the number of rotations, resulting in R 2= 0.0063, which indicates that number of rotations was not correlated to entropy values (Figure 2.7). Each entropy value was converted to symmetry using the equation for Boltzmann entropy. Entropy vs. symmetry was plotted for each image, and the result was a negative exponential relation between the two variables. An example is plotted for image ProvBay5_12lx450, Arachnoidiscus ehrenbergii and depicted in Figure 2.8. Measurement error was calculated as 0.000153 with 0.1068% bias.
The optimum number of rotations that gives the minimum entropy value was tested for those taxa with valve face features that were not easily divisible into equally spaced partitions. Image SClemtbx1800, Cyclotella meneghiniana , was tested with 3, 4, 5, 7, 13, 14, 15, 17, 18, 24, 27, 31, and 64 rotations, where 64 represents the actual number of marginal chambered striae in the image. Entropy values were plotted against number of rotations, and from a least-squares regression, no trend was discernable between the minimum entropy value and number of rotations (Figure 2.9). That is, an increasingly larger number of rotations used did not correlate to any improvement in obtaining a minimum entropy value (R 2= 0.1097). Fourteen rotations were used for taxa lacking distinguishing valve face features.
For all image entropies, a histogram and PDF was constructed and depicted a Gaussian distribution (Figure 2.10). The distribution has a slightly long left tail and is therefore slightly positively skewed. A CDF of all entropies was also constructed (Figure 2.11).
Average symmetry was determined and plotted for each taxon (Figure 2.12). A least-squares regression was performed that resulted in a best-fit curve of wt axon = 0.9051 S + 15.654, and the coefficient of determination was 0.9474. Average taxon symmetry was determined and plotted for all external valves (Figure 2.13). A least-squares regression was performed that resulted in a best-fit curve of wtaxon = 0.9457S + 15.473, and the coefficient of determination was 0.9451. External and forming valve average symmetries were compared for ten taxa. From the bar graph, Asteromphalus heptactis, Asteromphalus imbricatus, Asteromphalus shadboltianus, Asteromphalus vanheurckii, Asterolampra marylandica, Cyclotella meneghiniana , and Glyphodiscus stellatus had higher external valve symmetry than forming valve symmetry (Figure 2.14). Triceratium favus and Triceratium pentacrinus fo. quadrata had higher forming valve symmetry than external valve symmetry. Arachnoidiscus ehrenbergii had approximately equal forming and external symmetry (Figure 2.14).
Arachnoidiscus and Aulacodiscus with symmetric valve surfaces were compared to Asteromphalus with asymmetric valve surfaces using least-squares regression (Figure 2.15). Best-fit curves for species, x, were wtaxon = 1.1878x + 27.27, wtaxon = 1.276x + 30.67, and wtaxon = 2.2925x + 23.238 for Asteromphalus, Arachnoidiscus , and Aulacodiscus , respectively. Coefficients of determination were 0.7622 for Asteromphalus and 0.9645 for Arachnoidiscus, and Aulacodiscus .
A number of analyses were conducted to illustrate symmetry differences in different valves of Cyclotella meneghiniana . Normal and abnormal Cyclotella meneghiniana valve symmetries were compared using least-squares regression (Figure 2.16). Slope for normal valves was 1.345 compared to a slope of 1.008 for abnormal valves. Coefficients of determination were 0.9737 and 0.9284 for normal and abnormal valves, respectively. Masked images of Cyclotella meneghiniana initial valves were measured for symmetry and compared to normal vegetative valve symmetry. Average initial valve symmetry had much higher symmetry than normal external and forming vegetative valves (Figure 2.17). Different valve surface morphologies revealed differences in symmetry that were discernable via analysis using entropy.
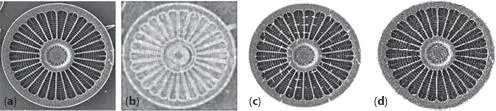
Figure 2.6ProvBay5_12lx450, Arachnoidiscus ehrenbergii . (a) Original scanning electron micrograph image; (b) Entropy filtering applied to image; (c) Vectors showing gradient changes in magnitude and direction; (d) Tilt-corrected image. Original SEM by Mary Ann Tiffany.
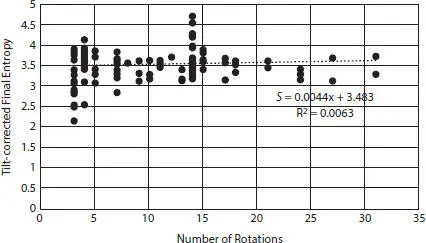
Figure 2.7Tilt-corrected final entropy vs. number of rotations for all images, omitting 64 rotations used for Cyclotella meneghiniana .
Measurement error for image matching rotation and overlaying was not a factor in symmetry analysis. Values ranged from 0.0000946 to 0.0184 measurement error with 0.0172 to 1.994% bias. The percentages fall within the range of values that do not affect the measurement of true variation [2.103]. For symmetry analysis, the entropy values measured are not biased by measurement error.
An image of Biddulphia sp. was used to illustrate measurement of dihedral symmetry. Entropy and symmetry values were 1.94041 and 6.96162 with a measurement error of 0.0000614 and a 0.00663% bias. Biddulphia sp. dihedral symmetry measurement was accomplished using rotation and flipping the masked image about the x and y axes in the x-y plane.
Valve formation was simulated in a simple model by sequentially adding concentric rings of valve structure from an annulus to the valve margin to cumulatively create a valve face surface. Although diatom valve formation is much more complicated than this, the simulation provided a glimpse into an intuitive way to view growth over time. Ten circular-shaped centric diatom images were chosen to illustrate the method for Actinoptychus senarius, Actinoptychus splendens, Arachnoidiscus ehrenbergii, Arachnoidiscus ornatus, Asterolampra marylandica , and Aulacodiscus oregonus . Twenty-four concentric rings were arbitrarily selected on each image. Each ring was of an arbitrary width and added cumulatively, starting with an annulus at the center and ending with a ring at the valve margin (Figure 2.18).
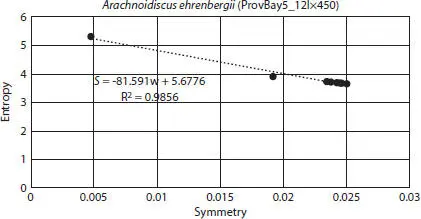
Figure 2.8Typical entropy vs. symmetry plot. The example is image ProvBay5_12lx450, Arachnoidiscus ehrenbergii . The first datum is the original masked tilt-corrected image.
Читать дальшеИнтервал:
Закладка:
Похожие книги на «Diatom Morphogenesis»
Представляем Вашему вниманию похожие книги на «Diatom Morphogenesis» списком для выбора. Мы отобрали схожую по названию и смыслу литературу в надежде предоставить читателям больше вариантов отыскать новые, интересные, ещё непрочитанные произведения.


Обсуждение, отзывы о книге «Diatom Morphogenesis» и просто собственные мнения читателей. Оставьте ваши комментарии, напишите, что Вы думаете о произведении, его смысле или главных героях. Укажите что конкретно понравилось, а что нет, и почему Вы так считаете.