Climate Impacts on Sustainable Natural Resource Management
Здесь есть возможность читать онлайн «Climate Impacts on Sustainable Natural Resource Management» — ознакомительный отрывок электронной книги совершенно бесплатно, а после прочтения отрывка купить полную версию. В некоторых случаях можно слушать аудио, скачать через торрент в формате fb2 и присутствует краткое содержание. Жанр: unrecognised, на английском языке. Описание произведения, (предисловие) а так же отзывы посетителей доступны на портале библиотеки ЛибКат.
- Название:Climate Impacts on Sustainable Natural Resource Management
- Автор:
- Жанр:
- Год:неизвестен
- ISBN:нет данных
- Рейтинг книги:4 / 5. Голосов: 1
-
Избранное:Добавить в избранное
- Отзывы:
-
Ваша оценка:
Climate Impacts on Sustainable Natural Resource Management: краткое содержание, описание и аннотация
Предлагаем к чтению аннотацию, описание, краткое содержание или предисловие (зависит от того, что написал сам автор книги «Climate Impacts on Sustainable Natural Resource Management»). Если вы не нашли необходимую информацию о книге — напишите в комментариях, мы постараемся отыскать её.
Climate Impacts on Sustainable Natural Resource Management — читать онлайн ознакомительный отрывок
Ниже представлен текст книги, разбитый по страницам. Система сохранения места последней прочитанной страницы, позволяет с удобством читать онлайн бесплатно книгу «Climate Impacts on Sustainable Natural Resource Management», без необходимости каждый раз заново искать на чём Вы остановились. Поставьте закладку, и сможете в любой момент перейти на страницу, на которой закончили чтение.
Интервал:
Закладка:
ƩA=total amount of the changed area of the land cover, ha
t 1= year of before the change
t 2= year of after the change
The sign (–/+) of the calculation result represents the C stock difference. The positive (+) stock difference represents the increase in C stocks known as negative emission (sequestration). The negative (–) stock changes represent the decreases in C stocks known as positive emission (emission). The remaining unchanged land cover class during the analysis period or among similar carbon stock would be estimated as no emission. For example, Table 1.1showed similar carbon stock for paddy/rice field and port and harbor (5 tC yr –1), transmigration areas and mixed dry agriculture (10 tC yr –1), and bare ground, mining area, open swamp, open water, fish pond/aquaculture, and cloud/no data (0 tC yr –1). The CO 2emission based on the total C stock difference was estimated for each land cover class every year by multiplying the total C stock change by 44/12.
1.2.4 Historical Baselines and Future Trajectories
Annual GHG emissions from 2000 to 2016 were divided into two periods for developing the baseline and REDD+ progress. The period to estimate a historical baseline of GHG emission trend before the commitment of REDD+ was from 2000 to 2010. The period to estimate the REDD+ progress of GHG emission trend after the commitment was from 2010 to 2016. The selection of 2010 as the base year was based on the official submission of Indonesia's commitment to the UNFCCC in 2010 (Indonesia 2013).
Both GHG emission baselines were then projected to estimate the future trajectories of GHG emissions in the target period of commitment. The target of Indonesia's commitment in 2030 (Indonesia, 2016) was considered to determine the final projection in this study. Some analytical tools can be used to predict the future trendlines in a possible downturn or upturn data by connecting many points on a graph. Understanding how to use the trendlines for predicting the trend in the future could help to reveal what might happen in the future. Both future trajectories of GHG emission were compared to measure the achievement of REDD+ progress in East Kalimantan for 2030.
1.3 Results
1.3.1 Annual GHG Emissions
Figure 1.1shows the annual GHG emissions in East Kalimantan between 2000 and 2016. The figure shows that a growing increase in GHG emissions occurred every year. Moreover, during the study period, the increase reached 31 Mt CO 2with an increment rate of 2.1 Mt CO 2yr –1. Although the annual GHG emissions showed an increasing trend every year, the increment rate before REDD+ commitment (2000–2010) was larger (2.3 Mt CO 2yr –1) than the increment rate after the commitment (1.5 Mt CO 2yr –1). So this result was able to illustrate the implication of the REDD+ strategies in East Kalimantan in reducing GHG emissions.
Figure 1.2shows size of the contribution of land cover change to GHG emission in the study area. According to the figure, deforestation (i.e. the changes of forest cover to non‐forest cover) and forest degradation (the changes of dense forest to less dense forest) gave a significant contribution to GHG emission in East Kalimantan. The deforestation caused the annual GHG emission increase of 25 Mt CO 2by 2016 with an increment rate of 1.7 Mt CO 2yr –1and it contributed about 80% of GHG emission in the study area, respectively. Forest degradation affected the annual GHG emission increase of 6 Mt CO 2from 2000 to 2016, with an increment rate of 0.3 Mt CO 2yr –1and it contributed about 20% of GHG emission. Moreover, the changes within non‐forest cover only contributed to the annual GHG emission increase of 0.7 Mt CO 2from 2000 to 2016, with an increment rate of 0.05 Mt CO 2yr –1.
Table 1.2shows the 10 largest emitters of GHG of land cover change over the 17 years. As shown in Table 1.2, most of the top 10 largest emitters were classified as the deforestation process. The changes of secondary dryland forest to dry shrubland, estate cropland, and plantation forest were the three largest GHG emitters in East Kalimantan ( Table 1.2), represented by 48.63%, 12.68%, and 10.04% of the total GHG emissions from 2000 to 2016, respectively. Furthermore, the conversion of secondary mangrove forest into wet shrubland and fish pond/aquaculture contributed 2.48% and 1.85% of total GHG emissions, respectively. Meanwhile, the change of secondary swamp forest into wet shrubland caused 1.66% of total GHG emissions. Moreover, the largest forest degradation occurred in the study area, and was represented by the degradation of primary dryland forest into secondary dryland forest, which contributed 5.43% of total GHG emissions, respectively.
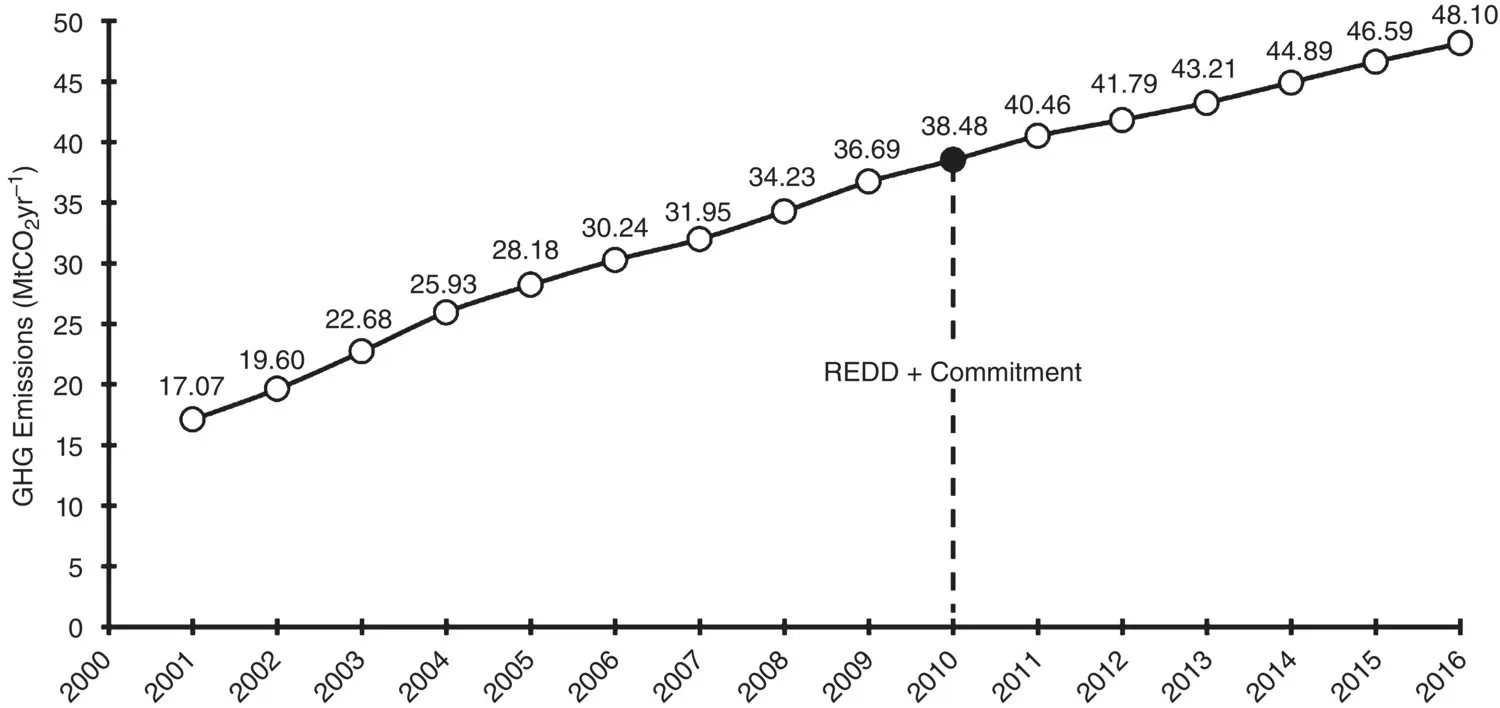
Figure 1.1 Annual GHG emissions (Mt CO 2yr –1) from 2000 to 2016.
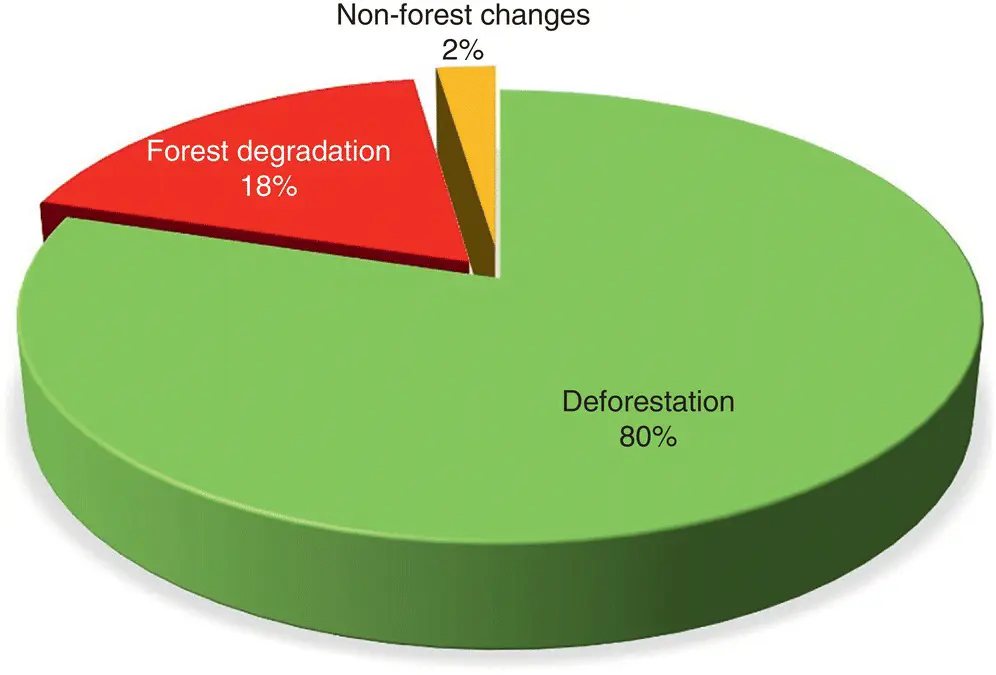
Figure 1.2 Percentage of GHG emissions from the land‐based sector (2000–2016).
Table 1.2 Ten largest GHG emitters from land‐based sector from 2000 to 2016.
| Land cover changes | Total area (ha) | Percentage of emission (%) | |
|---|---|---|---|
| From | To | ||
| Secondary dryland forest | Dry Shrub land | 471,625.19 | 48.63 |
| Secondary dryland forest | Estate Cropland | 178,297.07 | 12.68 |
| Secondary dryland forest | Plantation forest | 142,460.67 | 10.04 |
| Primary dryland forest | Secondary dryland forest | 317,020.70 | 5.43 |
| Secondary dryland forest | Bare ground | 46,444.85 | 5.25 |
| Secondary dryland forest | Mixed dry agriculture | 31,092.77 | 3.31 |
| Secondary dryland forest | Mining areas | 28,919.68 | 3.27 |
| Secondary mangrove forest | Wet shrubland | 35,461.77 | 2.48 |
| Secondary mangrove forest | Fish pond/aquaculture | 23,129.13 | 1.85 |
| Secondary swamp forest | Wet shrubland | 17,834.51 | 1.66 |
1.3.2 Historical Baselines and Future Trajectories
In this study, we used linear regression to predict the future trajectories of GHG emissions, as shown in Figure 1.3. Furthermore, the annual GHG emissions from 2000–2010 and 2010–2016 were extrapolated using linear regression in order to predict future trajectories for 2030 under two type of scenario: without REDD+ commitment (white circle) and with REDD+ commitment (black circle).
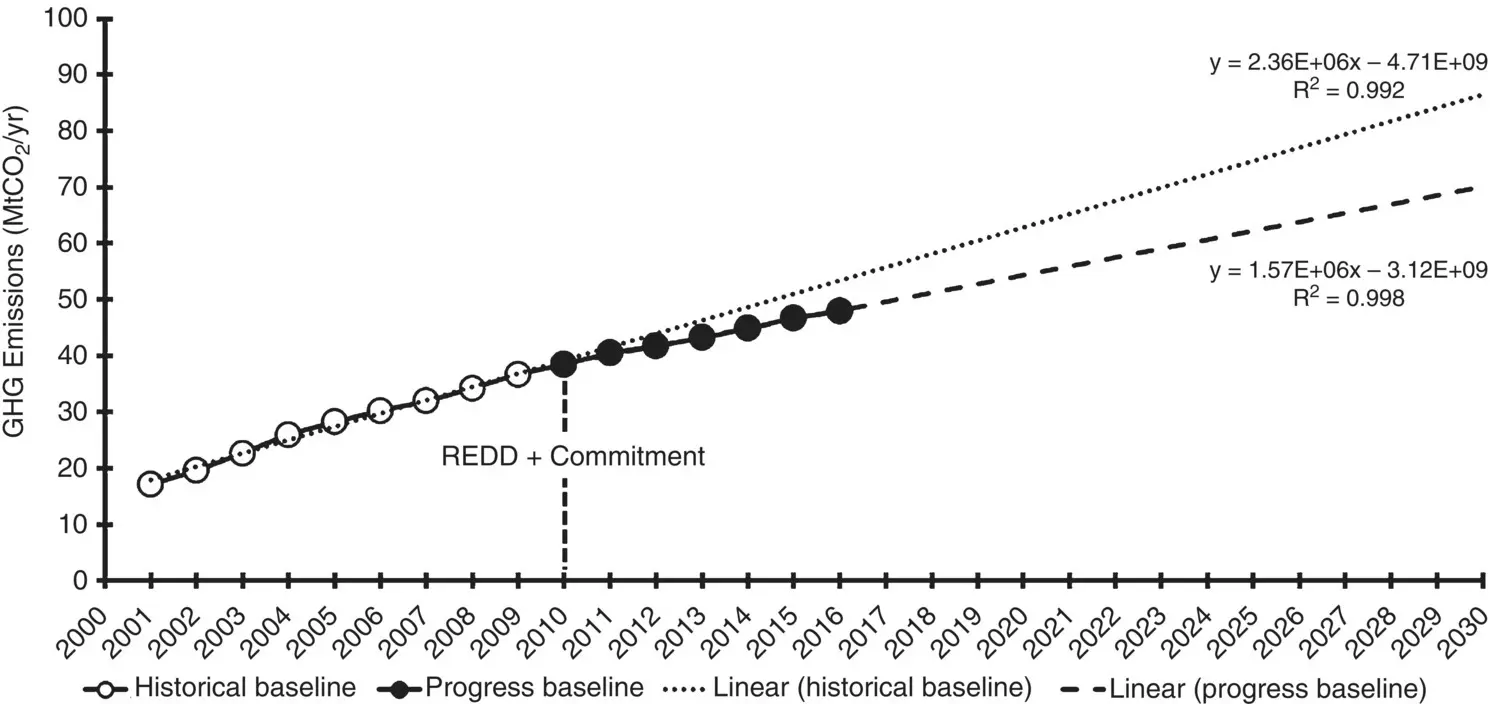
Figure 1.3 The trend lines of annual GHG emissions for predicting future trajectories.
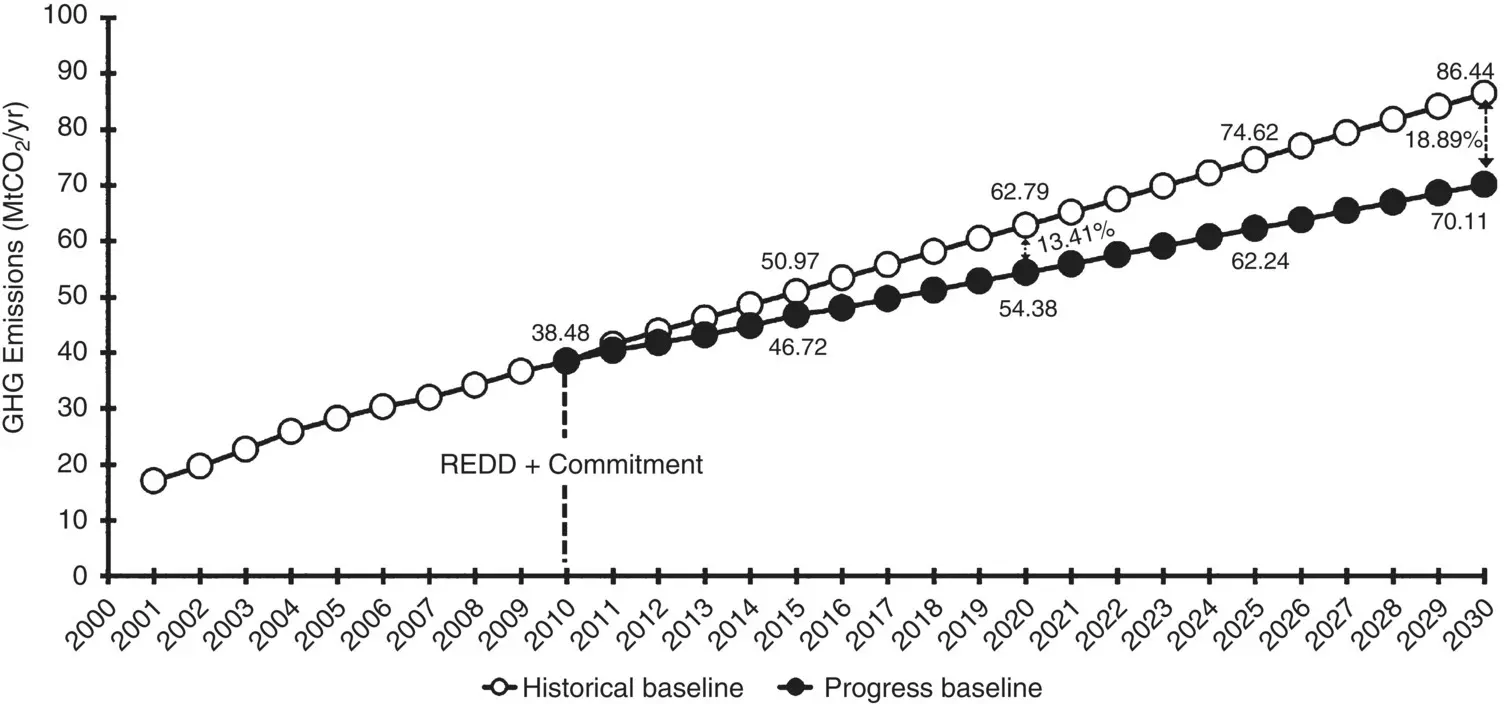
Figure 1.4 The percentage of REDD+ progress in East Kalimantan for 2030. Source: Based on East Kalimantan (2013).
Figure 1.4shows the future trajectories of GHG emissions in the study area. It states that under REDD+ commitment, the GHG emissions will be reduced by 13.41% in 2020. Furthermore, the GHG emission for 2030 (70.11 Mt CO 2) will be reduced by 18.89% from the historical baseline (86.44 Mt CO 2) if the province applied the REDD+ strategy consistently. These results projected that the REDD+ program implemented in East Kalimantan could reduce GHG emissions from historical baselines for 2020 and 2030.
Читать дальшеИнтервал:
Закладка:
Похожие книги на «Climate Impacts on Sustainable Natural Resource Management»
Представляем Вашему вниманию похожие книги на «Climate Impacts on Sustainable Natural Resource Management» списком для выбора. Мы отобрали схожую по названию и смыслу литературу в надежде предоставить читателям больше вариантов отыскать новые, интересные, ещё непрочитанные произведения.


Обсуждение, отзывы о книге «Climate Impacts on Sustainable Natural Resource Management» и просто собственные мнения читателей. Оставьте ваши комментарии, напишите, что Вы думаете о произведении, его смысле или главных героях. Укажите что конкретно понравилось, а что нет, и почему Вы так считаете.