Climate Impacts on Sustainable Natural Resource Management
Здесь есть возможность читать онлайн «Climate Impacts on Sustainable Natural Resource Management» — ознакомительный отрывок электронной книги совершенно бесплатно, а после прочтения отрывка купить полную версию. В некоторых случаях можно слушать аудио, скачать через торрент в формате fb2 и присутствует краткое содержание. Жанр: unrecognised, на английском языке. Описание произведения, (предисловие) а так же отзывы посетителей доступны на портале библиотеки ЛибКат.
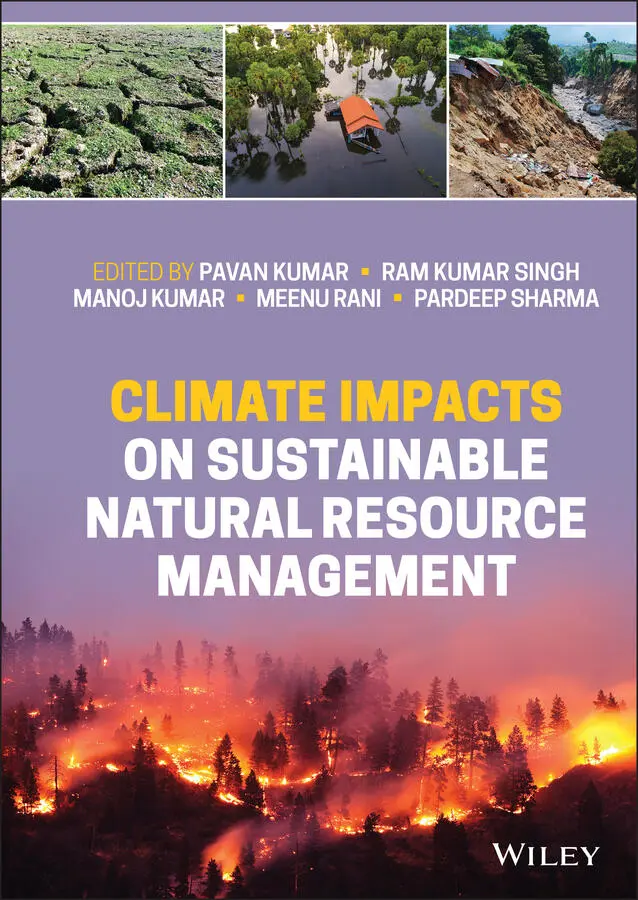
- Название:Climate Impacts on Sustainable Natural Resource Management
- Автор:
- Жанр:
- Год:неизвестен
- ISBN:нет данных
- Рейтинг книги:4 / 5. Голосов: 1
-
Избранное:Добавить в избранное
- Отзывы:
-
Ваша оценка:
Climate Impacts on Sustainable Natural Resource Management: краткое содержание, описание и аннотация
Предлагаем к чтению аннотацию, описание, краткое содержание или предисловие (зависит от того, что написал сам автор книги «Climate Impacts on Sustainable Natural Resource Management»). Если вы не нашли необходимую информацию о книге — напишите в комментариях, мы постараемся отыскать её.
Climate Impacts on Sustainable Natural Resource Management — читать онлайн ознакомительный отрывок
Ниже представлен текст книги, разбитый по страницам. Система сохранения места последней прочитанной страницы, позволяет с удобством читать онлайн бесплатно книгу «Climate Impacts on Sustainable Natural Resource Management», без необходимости каждый раз заново искать на чём Вы остановились. Поставьте закладку, и сможете в любой момент перейти на страницу, на которой закончили чтение.
Интервал:
Закладка:
6 Chapter 7Table 7.1 Crop area and farm families affected due to flood in Assam (2007–2...Table 7.2 Rice‐growing environments and productivity constraints.Table 7.3 Sahabhagi dhan yield comparison with other adjacent variety (2012–...Table 7.4 Targeted dissemination of STRVs in Assam and Uttar Pradesh during ...Table 7.5 Targeted dissemination of STRVs in Odisha during 2016–2020.Table 7.6 Yield advantage of sub 1 varieties over other traditionally grown ...Table 7.7 Adoption of Sahbhagi Dhan in eastern India states.
7 Chapter 9Table 9.1 Rainfall decile ranges and respective drought severity class.Table 9.2 Agricultural drought risk classification using VCI.Table 9.3 Drought severity parameters based on stream density in Monaragala ...Table 9.4 Drought severity parameters based on water source in Monaragala Di...Table 9.5 Percentage areas of Meteorological, Agricultural and Hydrological ...Table 9.6 Drought severity type and the percentage that affects for each div...
8 Chapter 10Table 10.1 Data used in SWAT model.Table 10.2 List of driving models used in multi‐model ensemble.Table 10.3 Historical and projected LULC maps used in the study.Table 10.4 Trends in climatic parameter in response to different climatic s...Table 10.5 Catchment specific trend in volumetric runoff (in cumecs) for di...Table 10.6 Catchment specific trend in surface runoff depth (in mm) for dif...
9 Chapter 11Table 11.1 Water quality parameters assessed, instruments and methods used,...Table 11.2 Spearman correlation coefficients between land uses and water qu...
10 Chapter 12Table 12.1 Welfare impact of climate change.Table 12.2 Key climate change risks, its major driving elements, adaptation...
11 Chapter 14Table 14.1 Description of land cover used in the study.Table 14.2 The distribution of land cover/land use extent in 2009 and 2019 ...Table 14.3 Non‐parametric ANOVA test of significance on land cover change.Table 14.4 Confusion matrix of the year 2019 for land cover classification.Table 14.5 The temperature in oC of LST obtained from Met Malaysia, MODIS, a...
12 Chapter 15Table 15.1 List of transgenic plants engineered for stress tolerance using ...
13 Chapter 16Table 16.1 The increment sampling sites of conifers in SFD Tangmar.Table 16.2 Species‐wise average diameter increments (mm)Table 16.3 Site‐wise average diameter increments (mm).Table 16.4 Diameter class‐wise average diameter increments (mm).
List of Illustrations
1 Chapter 1 Figure 1.1 Annual GHG emissions (Mt CO 2yr –1) from 2000 to 2016. Figure 1.2 Percentage of GHG emissions from the land‐based sector (2000–2016... Figure 1.3 The trend lines of annual GHG emissions for predicting future tra... Figure 1.4 The percentage of REDD+ progress in East Kalimantan for 2030. Sou ...
2 Chapter 2 Figure 2.1 Different components of remote sensing used for collecting a wide... Figure 2.2 Applications of geospatial techniques for forest resource assessm... Figure 2.3 Representation of multiple spatial layers that can be developed w... Figure 2.4 Development of thematic maps and their integration for the priori... Figure 2.5 Applications of geospatial techniques for crop monitoring and man... Figure 2.6 Satellite and LiDAR data fusion for natural resource management.... Figure 2.7 Various applications of Google Earth Engine for natural resource ...
3 Chapter 3 Figure 3.1 Support vectors machine, (a) nonlinearly separable case, (b) line... Figure 3.2 Location of study area (a) map of Chile, (b) selected area of Cer... Figure 3.3 (a) Level 1 quad pol dataset for Cerro Laukaru, Chile SIR‐C SAR i... Figure 3.4 (a) Entropy, (b) Anisotropy, (c) Alpha for Cerro Laukaru, Chile S... Figure 3.5 Unsupervised classification for Cerro Laukaru, Chile SIR‐C SAR im... Figure 3.6 Graph for comparison between unsupervised classifications for Cer... Figure 3.7 Graph of SAR statistical parameter for unsupervised classificatio... Figure 3.8 Supervised classification image for Cerro Laukaru, Chile SIR‐C SA...Figure 3.9 Graph of omission error for Cerro Laukaru, Chile SIR‐C SAR image....Figure 3.10 Graph of commission error for Cerro Laukaru, Chile SIR‐C SAR ima...Figure 3.11 Graph of accuracy assessment Cerro Laukaru, Chile SIR‐C SAR imag...
4 Chapter 4Figure 4.1 Map and landscapes of the study area: (a) Location of the study a...Figure 4.2 Landsat scenes of study area which acquired on (a) 2000 and (b) 2...Figure 4.3 The land cover maps generated by CNNs model for (a) Landsat‐5 TM ...Figure 4.4 Change detection maps: (a) 1980–2000, (b) 2000–2020.
5 Chapter 5Figure 5.1 Interlinkages of plant traits and abiotic factors with the growth...Figure 5.2 Processes and elements controlling plant productivity.
6 Chapter 6Figure 6.1 Map showing distribution of Indian Himalayan subtropical pine for...Figure 6.2 Indigenous Pine species found in India. ( Pinus roxburghii , Pinus ...Figure 6.3 The upright forest biomass pyramid indicating that the primary pr...Figure 6.4 Approximate distribution of biomass in different components of a ...Figure 6.5 Various conversion factors used in biomass estimation studies....Figure 6.6 Methodological steps adopted for estimating forest biomass and ca...
7 Chapter 7Figure 7.1 Location map of study area.Figure 7.2 Methodology for targeted dissemination of submergence‐tolerant ri...Figure 7.3 Methodology for targeted dissemination for drought‐tolerant rice ...Figure 7.4 Potential sites for the dissemination of Sub 1 rice varieties.Figure 7.5 Methodology for targeted dissemination for drought‐tolerant rice ...Figure 7.6 Yield of Sub 1 rice varieties in submergence condition, Assam.Figure 7.7 Yield advantage of STRVs in drought‐prone ecology in Assam.Figure 7.8 Submergence tolerance of BINA dhan 11 vs other adjacent varieties...Figure 7.9 Increasing seed sale of Bina dhan 11 in Odisha from 2016 to 2019....
8 Chapter 8Figure 8.1 Study area. Map data: Google, DigitalGlobe.Figure 8.2 Average monthly rainfall (mm) – May.Figure 8.3 Average monthly rainfall (mm) – June.Figure 8.4 Average monthly rainfall (mm) – July.Figure 8.5 Average monthly rainfall (mm) – August.Figure 8.6 Average monthly rainfall (mm) – September.Figure 8.7 Average monthly rainfall (mm) – October.Figure 8.8 Average monthly rainfall (mm) – November.Figure 8.9 Average annual rainfall (mm) – May to November.Figure 8.10 Number of rainy days in May.Figure 8.11 Number of rainy days in June.Figure 8.12 Number of rainy days in July.Figure 8.13 Number of rainy days in August.Figure 8.14 Number of rainy days in September.Figure 8.15 Number of rainy days in October.Figure 8.16 Number of rainy days in November.Figure 8.17 Average rainy days (annual).Figure 8.18 Percentage change in rainfall – May.Figure 8.19 Percentage change in rainfall – June.Figure 8.20 Percentage change in rainfall – July.Figure 8.21 Percentage change in rainfall – August.Figure 8.22 Percentage change in rainfall – September.Figure 8.23 Percentage change in rainfall – October.Figure 8.24 Percentage change in rainfall – November.Figure 8.25 Percentage change in rainfall – Annual.Figure 8.26 Annual household income.Figure 8.27 Understanding farmers' (respondents') perception of climate chan...Figure 8.28 Scale used to represent confidence level of the respondents.
9 Chapter 9Figure 9.1 Study area, Monaragala District, Uva Province of Sri Lanka;Figure 9.2 The complete workflow of the experiments conducted under the stud...Figure 9.3 Rainfall data‐based Meteorological drought analysis map of Monara...Figure 9.4 MODIS satellite image data‐based Agricultural drought analysis ma...Figure 9.5 Stream density‐based drought severity classification map of Monar...Figure 9.6 Irrigated area and water source‐based drought severity classifica...Figure 9.7 Stream density, irrigated area, and water source‐based Hydrologic...Figure 9.8 Drought risk area map (combination of Meteorological, Agricultura...Figure 9.9 Spatial percentage of coverage of the drought risk area (combinat...Figure 9.10 The percentage of the drought level in each divisional sectarian...
Читать дальшеИнтервал:
Закладка:
Похожие книги на «Climate Impacts on Sustainable Natural Resource Management»
Представляем Вашему вниманию похожие книги на «Climate Impacts on Sustainable Natural Resource Management» списком для выбора. Мы отобрали схожую по названию и смыслу литературу в надежде предоставить читателям больше вариантов отыскать новые, интересные, ещё непрочитанные произведения.


Обсуждение, отзывы о книге «Climate Impacts on Sustainable Natural Resource Management» и просто собственные мнения читателей. Оставьте ваши комментарии, напишите, что Вы думаете о произведении, его смысле или главных героях. Укажите что конкретно понравилось, а что нет, и почему Вы так считаете.