Change Detection and Image Time Series Analysis 2
Здесь есть возможность читать онлайн «Change Detection and Image Time Series Analysis 2» — ознакомительный отрывок электронной книги совершенно бесплатно, а после прочтения отрывка купить полную версию. В некоторых случаях можно слушать аудио, скачать через торрент в формате fb2 и присутствует краткое содержание. Жанр: unrecognised, на английском языке. Описание произведения, (предисловие) а так же отзывы посетителей доступны на портале библиотеки ЛибКат.
- Название:Change Detection and Image Time Series Analysis 2
- Автор:
- Жанр:
- Год:неизвестен
- ISBN:нет данных
- Рейтинг книги:4 / 5. Голосов: 1
-
Избранное:Добавить в избранное
- Отзывы:
-
Ваша оценка:
Change Detection and Image Time Series Analysis 2: краткое содержание, описание и аннотация
Предлагаем к чтению аннотацию, описание, краткое содержание или предисловие (зависит от того, что написал сам автор книги «Change Detection and Image Time Series Analysis 2»). Если вы не нашли необходимую информацию о книге — напишите в комментариях, мы постараемся отыскать её.
Change Detection and Image Time Series Analysis 2 — читать онлайн ознакомительный отрывок
Ниже представлен текст книги, разбитый по страницам. Система сохранения места последней прочитанной страницы, позволяет с удобством читать онлайн бесплатно книгу «Change Detection and Image Time Series Analysis 2», без необходимости каждый раз заново искать на чём Вы остановились. Поставьте закладку, и сможете в любой момент перейти на страницу, на которой закончили чтение.
Интервал:
Закладка:
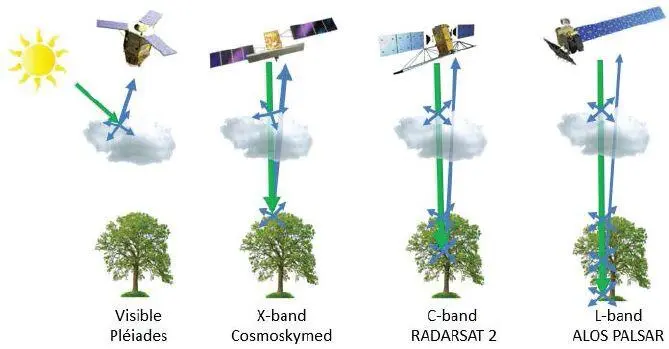
Figure 1.1. Sensitivity to cloud cover and object size using different wavelength ranges. For a color version of this figure, see www.iste.co.uk/atto/change2.zip
As illustrated in Figure 1.1, SAR and multispectral images exhibit complementary properties in terms of wavelength range (active microwave vs. passive visible and infrared), noisy behavior (often strong in SAR due to speckle, usually less critical in optical imagery), feasibility of photo-interpretation (usually easier with optical than with SAR data), impact of atmospheric conditions and cloud cover (strong for optical acquisitions and almost negligible for SAR) and sensitivity to sun-illumination (strong for optical imagery and negligible for SAR) (Landgrebe 2003; Ulaby and Long 2015). This makes the joint use of high-resolution optical and SAR imagery particularly interesting for many applications related to environmental monitoring and risk management (Serpico et al. 2012).
Within this framework, there is a definite need for classification methods that automatically correlate different sets of images taken at different times, in the same area, from different sensors and at different resolutions. One way to address this problem is to resort to an explicit statistical modeling by finding a joint probability distribution, given the class-conditional marginal probability density function (PDF) of the data collected by each sensor (see Figure 1.2). The joint statistics can be designed by resorting to meta-Gaussian distributions (Storvik et al. 2009), multivariate statistics such as multivariate copulas (Voisin et al. 2014) or non-parametric density estimators (Fukunaga 2013). However, employing heterogeneous data (SAR–optical in our case) makes the task of finding an appropriate multivariate statistical model complex, time demanding and possibly prone to overfitting.
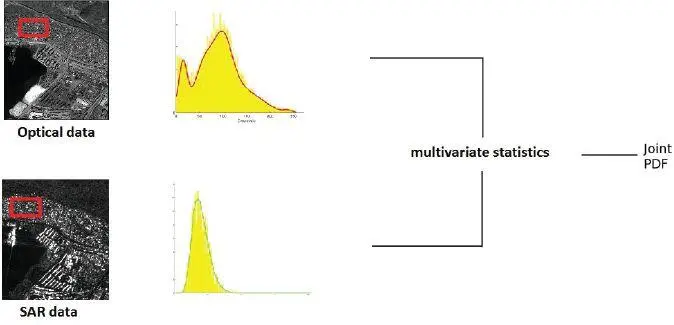
Figure 1.2. Multivariate statistical modeling for optical–SAR data fusion. For a color version of this figure, see www.iste.co.uk/atto/change2.zip
In this context, the rationale of both approaches described in section 1.2is to benefit from the data fusion capabilities of hierarchical MRFs and avoid the computation of joint statistics. An approach based on multiple quad-trees in cascade and applied to multisensor and multiresolution fusion is described. In the first proposed method, for each sensor, the input images of the series are associated with separate quad-tree structures according to their resolutions. The goal is to generate a classification map based on a series of SAR and optical images acquired over the same area. The proposed approach formalizes, within this multiple quad-tree topology, a supervised Bayesian classifier that combines a class-conditional statistical model for pixelwise information and a hierarchical MRF for multisensor and multiresolution contextual information. The second proposed method regards the case of the multimission fusion of multifrequency SAR data collected by the COSMO-SkyMed and RADARSAT-2 sensors, together with optical Pléiades data. A multiple quad-tree structure is used again, but optical and SAR images are both included in all cascaded quad-trees to take into account the specifics of the spatial resolutions of the considered satellite instruments. Compared to the first method, which considers the fusion of data from generally arbitrary SAR and optical sensors, this second method focuses on a specific combination of spaceborne SAR and optical sensors, in order to investigate the synergy among the multifrequency and multiresolution information they provide.
1.1.3. Previous work
The literature in remote sensing data fusion is extensive, indicating intense interest in this topic, as highlighted by the recent sharp increase in the number of papers published in the major remote sensing journals, and the increasing number of related sessions in international conferences. Indeed, data fusion has given rise to a continuing tradition in remote sensing, since EO is by definition dynamic (thus implying the multitemporal capability of remote sensing instruments), multiresolution (multiple spatial and spectral resolutions) and related to different physical quantities (thus requiring multiview/multisensor capability) (Waltz and Llinas 1990).
Data fusion is defined differently depending on the final goal of the user. Indeed, (Li et al. 1995; Pohl and van Genderen 2014) considered data fusion in remote sensing as the combination of two or more algorithms. This may include, but is not restricted to multiresolution fusion and pansharpening techniques , whose aim is to obtain multispectral images of increased spatial resolution (Vivone et al . 2015), resolution blending that consists of providing time series of data at their maximum spatial and spectral resolutions (referred to as parallel pansharpening in the multitemporal domain) (Huang and Song 2012), and data fusion for missing information reconstruction , by using complementary data (Wang and Liang 2014).
An alternative perspective is to define data fusion in remote sensing as a decision fusion process that combines the information that is obtained from different data sets and provides sufficient generalization capability (Wald 1999). According to this definition, any type of image processing that combines two or more data sets, for example, for land cover classification, atmospheric correction or application of vegetation indices, could be considered as data fusion.
Within the former definition, various families of data fusion techniques have been proposed in the literature. On the one hand, these methods may generally differ in their application requirements , such as the availability of ground reference data, the collected prior information and/or some ancillary data that can be used in the development of the system according to a multisource processing architecture. On the other hand, it is important to properly understand the user needs with respect to economic costs and processing time and performance. Figure 1.3 summarizes the general architecture of a data fusion technique.
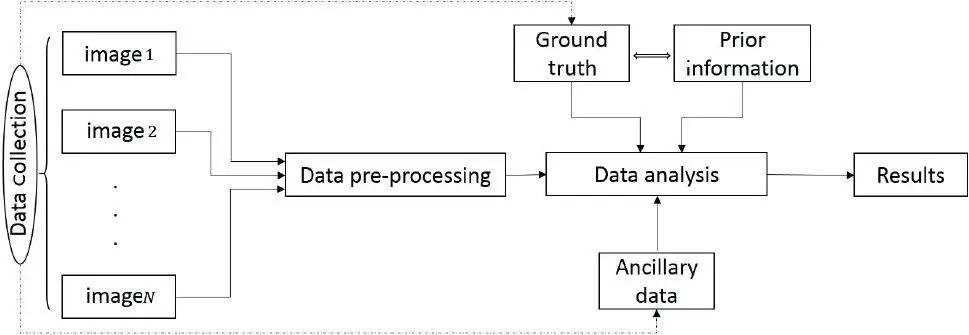
Figure 1.3. General data fusion architecture. Images 1 through N have generally been acquired by distinct sensors, at different spatial resolutions and/or with different radar frequencies and spectral bands
As discussed previously, the availability of remote sensing imagery at varying resolutions has increased. Merging images of different spatial resolutions has become a significant operation in the field of digital remote sensing. A variety of different multiscale fusion approaches have been developed since the late 1980s. In the following, we give an overview of the most common approaches found in the literature. We can broadly divide them into two groups: (i) transformation techniques and (ii) modeling techniques.
Methods in (i) consist of replacing the entire set of multiscale images by a single composite representation that incorporates all relevant data. The multiscale transformations usually employ pyramid transforms (Burt 1984), the discrete wavelet transform (Piella 2003; Forster et al. 2004; Zhang and Hong 2005), the undecimated wavelet transform (Rockinger 1996; Chibani and Houacine 2003), the dual-tree complex wavelet transform (Demirel and Anbarjafari 2010; Iqbal et al . 2013; Zhang and Kingsbury 2015; Nelson et al. 2018), the curvelet transform (Choi et al. 2005; Nencini et al. 2007), the contourlet transform (ALEjaily et al. 2008; Shah et al. 2008) and the nonsubsampled contourlet transform (Yang et al. 2007).
Читать дальшеИнтервал:
Закладка:
Похожие книги на «Change Detection and Image Time Series Analysis 2»
Представляем Вашему вниманию похожие книги на «Change Detection and Image Time Series Analysis 2» списком для выбора. Мы отобрали схожую по названию и смыслу литературу в надежде предоставить читателям больше вариантов отыскать новые, интересные, ещё непрочитанные произведения.


Обсуждение, отзывы о книге «Change Detection and Image Time Series Analysis 2» и просто собственные мнения читателей. Оставьте ваши комментарии, напишите, что Вы думаете о произведении, его смысле или главных героях. Укажите что конкретно понравилось, а что нет, и почему Вы так считаете.