Reservoir Characterization
Здесь есть возможность читать онлайн «Reservoir Characterization» — ознакомительный отрывок электронной книги совершенно бесплатно, а после прочтения отрывка купить полную версию. В некоторых случаях можно слушать аудио, скачать через торрент в формате fb2 и присутствует краткое содержание. Жанр: unrecognised, на английском языке. Описание произведения, (предисловие) а так же отзывы посетителей доступны на портале библиотеки ЛибКат.

- Название:Reservoir Characterization
- Автор:
- Жанр:
- Год:неизвестен
- ISBN:нет данных
- Рейтинг книги:3 / 5. Голосов: 1
-
Избранное:Добавить в избранное
- Отзывы:
-
Ваша оценка:
Reservoir Characterization: краткое содержание, описание и аннотация
Предлагаем к чтению аннотацию, описание, краткое содержание или предисловие (зависит от того, что написал сам автор книги «Reservoir Characterization»). Если вы не нашли необходимую информацию о книге — напишите в комментариях, мы постараемся отыскать её.
This collection of papers covers the strategic and economic implications of methods used to characterize petroleum reservoirs. Born out of the journal by the same name, formerly published by Scrivener Publishing, most of the articles in this volume have been updated, and there are some new additions, as well, to keep the engineer abreast of any updates and new methods in the industry.
Truly a snapshot of the state-of-the-art, this groundbreaking volume is a must-have for any petroleum engineer working in the field, environmental engineers, petroleum engineering students, and any other engineer or scientist working with reservoirs.
Reservoir Characterization — читать онлайн ознакомительный отрывок
Ниже представлен текст книги, разбитый по страницам. Система сохранения места последней прочитанной страницы, позволяет с удобством читать онлайн бесплатно книгу «Reservoir Characterization», без необходимости каждый раз заново искать на чём Вы остановились. Поставьте закладку, и сможете в любой момент перейти на страницу, на которой закончили чтение.
Интервал:
Закладка:
We also construct and test adaptive aggregated anomaly classifiers designed to identify anomalies with unknown properties. They are built as a linear combination of measured parameters:
(3.7) 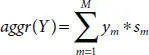
Weights sm in Eq. 3.7should be adjusted according the properties of a specific anomaly. In this paper, the writers showed a technique for the optimization of these coefficients for detection of an anomaly with unknown properties.
3.4 Prior and Posterior Characteristics of Anomaly Detection Performance
To characterize anomaly detection quality, we introduced and distinguished two types of quality characteristics: (a) Prior quality characteristics and (b) Posterior (actual) quality characteristics. The only prior classification quality characteristic is an expected false discovery rate (expFD). Value of the expected false discovery rate is assigned prior to performing data analysis. It is used for calculation of anomaly detection cutoff (AD cutoff) on the data in a training set. Posterior characteristics are calculated on the test set with identified regular and anomaly records. They include true and false discovery rates as functions of the AD cutoff. True and false discovery rates form a posterior ROC curve, which is used for evaluation of area under the ROC curve and comparative analysis of efficiency of several anomaly detection classifiers.
The writers used bootstrap for statistical analysis of anomaly detection results and did comparative analysis of properties of posterior efficiency characteristics. At each bootstrap run, sampling with replacement was done and a randomly formed pair of training and test set was constructed. The training set was selected from a pool of regular records. Each test set contained both regular and anomaly records. Multiple pairs of training and test sets produced by random sampling were utilized for calculation of quality characteristics of AD classifiers. They included mean and median values, and width of the quantile region for analyzed AD characteristics. They also included analysis of parameters characterizing relations between expected false discovery rate and posterior AD characteristics. The ROC curve analysis was done using multiple posterior ROC curves.
Figure 3.1illustrates the methodology for one-class anomaly detection technique that starts with an assignment of expected FDR and calculation of anomaly classification cutoff. It also demonstrates a high level of performance of the divergence classifier.
First 20 values in the Figure 3.1marked by circles ( Index ≤20) are the values of the divergence classifier on the records from the training set. The points marked by triangles and crosses ( Index >20) show values of the divergence classifier on the records from the test set. The horizontal dashed line shows anomaly detection cutoff. Records with the values above the cutoff are classified as anomalous. One can observe that distribution of the values of the divergence classifier on the regular records in the test set is very similar to that in the training set. On the other hand, the values of the divergence for anomaly records are systematically higher compared to divergence for regular records. The anomaly detection cutoff corresponds to the expected false discovery rate of 15%. Expected FDR is calculated as percent of records in the training set that exceeds AD cutoff. Posterior true and false discovery rates are, respectively, the percentages of regular and anomaly records in the test set exceeding AD cutoff. In this particular case, the posterior false discovery rate is smaller compared to the expected FDR and equals 6.6%. True discovery rate is high and equals 84%. High true discovery rate is due to the large proportion of anomaly records characterized by positive divergence values. Low posterior FDR is due to the fact that divergence values on a large proportion of regular records in the test set are smaller than the classification cutoff.
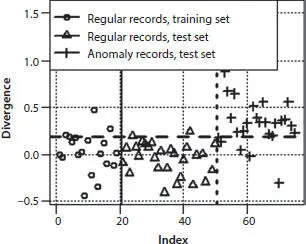
Figure 3.1 Divergence values for records in training and test set. The horizontal dashed line is the classification cutoff for the expected false discovery rate of 15%. The test set contains 30 regular records and 25 anomaly records from gas-filled sands. Each record ( Vp / Vs and Posson’s ratio).
Figure 3.2illustrates an effect of the size of the training set on the possible difference between posterior and expected false discovery rates. Black dots on both plots show expected versus posterior FDR for randomly sampled training and test sets. Continuous lines represent regression of the mean expected vs. the mean posterior FDR. Both regression lines are averaged over 1000 randomly sampled sets. On average, expected and posterior false discovery rates are about the same for both sizes of the training set. On the other hand, random differences between expected and posterior FDR are much larger for the training sets with a smaller number of records.
Table 3.1shows mean values of posterior false and true discovery rates of three AD methods, applied for detection of the gas-filled sand anomaly. To get mean values shown in the Table 3.1, 1000 randomly sampled training and test sets were created and each pair of the training-test sets was used for calculation of posterior true and false discovery rates. An expected false discovery rate was assigned the value of 20%. According to the Table 3.1, the mean value of the posterior false discovery rate is about the same and very close to the expected false discovery rate for all three AD methods. On the other hand, posterior true discovery rate is different using different methods and is the largest for the divergence classifier.
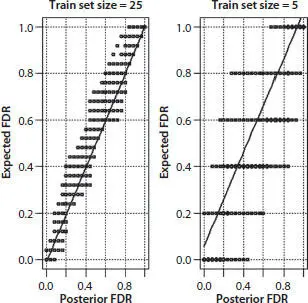
Figure 3.2 Expected versus posterior false discovery rate for two sizes of the training set. Classifier: distance from the center of the training set. Coordinates of a record: Poisson’s Ratio and Vp/Vs.
Table 3.1 Mean values of false and true discovery rates for three classifiers in detection of gas-filled sands anomaly. Size of the training set: 20 records.
| AD method | Expected false discovery rate (%) | Mean of posterior false discovery rate (%) | Mean of posterior true discovery rate (%) |
|---|---|---|---|
| Sparsity | 20 | 20.44 | 60.85 |
| Distance | 20 | 20.44 | 71.32 |
| Divergence | 20 | 20.49 | 85.71 |
Since the divergence classifier was specifically designed for detection of gas-filled sand anomalies, it outperforms two universal classifiers. Its mean the posterior true discovery rate is as high as 85%.
3.5 ROC Curve Analysis
The ROC curve analysis presented in this section is based on the analysis of results of anomaly detection with 1000 bootstrap sampled training and test sets of different size. Two input petrophysical parameters, Poisson’s Ratio and Vp/Vs , were used for calculation of AD classifiers for each of the pair training - test sets. For every training set, the expected value of the false discovery rate was assigned, and distributions of posterior true and false discovery rates were calculated on anomaly detection results.
Читать дальшеИнтервал:
Закладка:
Похожие книги на «Reservoir Characterization»
Представляем Вашему вниманию похожие книги на «Reservoir Characterization» списком для выбора. Мы отобрали схожую по названию и смыслу литературу в надежде предоставить читателям больше вариантов отыскать новые, интересные, ещё непрочитанные произведения.


Обсуждение, отзывы о книге «Reservoir Characterization» и просто собственные мнения читателей. Оставьте ваши комментарии, напишите, что Вы думаете о произведении, его смысле или главных героях. Укажите что конкретно понравилось, а что нет, и почему Вы так считаете.