Joseph Schmuller - Statistical Analysis with Excel For Dummies
Здесь есть возможность читать онлайн «Joseph Schmuller - Statistical Analysis with Excel For Dummies» — ознакомительный отрывок электронной книги совершенно бесплатно, а после прочтения отрывка купить полную версию. В некоторых случаях можно слушать аудио, скачать через торрент в формате fb2 и присутствует краткое содержание. Жанр: unrecognised, на английском языке. Описание произведения, (предисловие) а так же отзывы посетителей доступны на портале библиотеки ЛибКат.
- Название:Statistical Analysis with Excel For Dummies
- Автор:
- Жанр:
- Год:неизвестен
- ISBN:нет данных
- Рейтинг книги:4 / 5. Голосов: 1
-
Избранное:Добавить в избранное
- Отзывы:
-
Ваша оценка:
Statistical Analysis with Excel For Dummies: краткое содержание, описание и аннотация
Предлагаем к чтению аннотацию, описание, краткое содержание или предисловие (зависит от того, что написал сам автор книги «Statistical Analysis with Excel For Dummies»). Если вы не нашли необходимую информацию о книге — напишите в комментариях, мы постараемся отыскать её.
fully updated for the 2021 version of Excel, you’ll hit the ground running with straightforward techniques and practical guidance to unlock the power of statistics in Excel.
Bypass unnecessary jargon and skip right to mastering formulas, functions, charts, probabilities, distributions, and correlations. Written for professionals and students without a background in statistics or math, you’ll learn to create, interpret, and translate statistics—and have fun doing it!
In this book you’ll find out how to:
Understand, describe, and summarize any kind of data, from sports stats to sales figures Confidently draw conclusions from your analyses, make accurate predictions, and calculate correlations Model the probabilities of future outcomes based on past data Perform statistical analysis on any platform: Windows, Mac, or iPad Access additional resources and practice templates through Dummies.com For anyone who’s ever wanted to unleash the full potential of statistical analysis in Excel—and impress your colleagues or classmates along the way—
walks you through the foundational concepts of analyzing statistics and the step-by-step methods you use to apply them.
Statistical Analysis with Excel For Dummies — читать онлайн ознакомительный отрывок
Ниже представлен текст книги, разбитый по страницам. Система сохранения места последней прочитанной страницы, позволяет с удобством читать онлайн бесплатно книгу «Statistical Analysis with Excel For Dummies», без необходимости каждый раз заново искать на чём Вы остановились. Поставьте закладку, и сможете в любой момент перейти на страницу, на которой закончили чтение.
Интервал:
Закладка:
Another election-related example speaks to the idea of the confidence in the decision. Pre-election polls (again, assuming a representative sample of voters) tell you the percentage of sampled voters who prefer each candidate. The polling organization adds how accurate it believes the polls are. When you hear a newscaster say something like “accurate to within 3 percent,” you're hearing a judgment about confidence.
Here’s another example. Suppose you’ve been assigned to find the average reading speed of all fifth grade children in the United States but you haven’t got the time or the money to test them all. What would you do?
Your best bet is to take a sample of fifth-graders, measure their reading speeds (in words per minute), and calculate the average of the reading speeds in the sample. You can then use the sample average as an estimate of the population average.
Estimating the population average is one kind of inference that statisticians make from sample data. I discuss inference in more detail in the upcoming section “ Inferential Statistics: Testing Hypotheses.”
 Here’s some terminology you have to know: Characteristics of a population (like the population average) are called parameters, and characteristics of a sample (like the sample average) are called statistics. When you confine your field of view to samples, your statistics are descriptive. When you broaden your horizons and concern yourself with populations, your statistics are inferential.
And here’s a notation convention you have to know: Statisticians use Greek letters ((μ, σ, ρ) to stand for parameters, and English letters 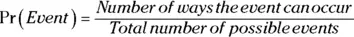 , s , r ) to stand for statistics. Figure 1-1 summarizes the relationship between populations and samples, and between parameters and statistics.

FIGURE 1-1:The relationship between populations and samples, and between parameters and statistics.
Variables: Dependent and independent
Simply put, a variable is something that can take on more than one value. (Something that can have only one value is called a constant. ) Some variables you might be familiar with are today’s temperature, the Dow Jones Industrial Average, your age, and the value of the dollar against the euro.
Statisticians care about two kinds of variables: independent and dependent. Each kind of variable crops up in any study or experiment, and statisticians assess the relationship between them.
Imagine a new way of teaching reading that’s intended to increase the reading speed of fifth-graders. Before putting this new method into schools, it’s a good idea to test it. To do that, a researcher randomly assigns a sample of fifth-grade students to one of two groups: One group receives instruction via the new method, and the other receives instruction via traditional methods. Before and after both groups receive instruction, the researcher measures the reading speeds of all the children in this study. What happens next? I get to that in the upcoming section “ Inferential Statistics: Testing Hypotheses.”
For now, understand that the independent variable here is the method of instruction. The two possible values of this variable are new and traditional. The dependent variable is the improvement in reading speed (a child’s speed after instruction minus that child’s speed before instruction) — which you would measure in words per minute.
In general, the idea is to find out if changes in the independent variable are associated with changes in the dependent variable.
In the examples that appear throughout the book, I show you how to use Excel to calculate characteristics of groups of scores. Keep in mind that each time I show you a group of scores, I'm really talking about the values of a dependent variable.
Types of data
Data come in four kinds. When you work with a variable, the way you work with it depends on what kind of data it is.
The first variety is called nominal data. If a number is a piece of nominal data, it’s just a name. Its value doesn't signify anything. A good example is the number on an athlete’s jersey. It’s just a way of identifying the athlete. The number has nothing to do with the athlete’s level of skill.
Next come ordinal data. Ordinal data are all about order, and numbers begin to take on meaning over and above just being identifiers. A higher number indicates the presence of more of a particular attribute than a lower number. One example is the Mohs scale: Used since 1822, it’s a scale whose values are 1 through 10; mineralogists use this scale to rate the hardness of substances. Diamond, rated at 10, is the hardest. Talc, rated at 1, is the softest. A substance that has a given rating can scratch any substance that has a lower rating.
What’s missing from the Mohs scale (and from all ordinal data) is the idea of equal intervals and equal differences. The difference between a hardness of 10 and a hardness of 8 is not the same as the difference between a hardness of 6 and a hardness of 4.
Interval data provide equal differences. Fahrenheit temperatures provide an example of interval data. The difference between 60 degrees and 70 degrees is the same as the difference between 80 degrees and 90 degrees.
Here’s something that might surprise you about Fahrenheit temperatures: A temperature of 100 degrees isn’t twice as hot as a temperature of 50 degrees. For ratio statements (twice as much as, half as much as) to be valid, zero has to mean the complete absence of the attribute you're measuring. A temperature of 0 degrees F doesn’t mean the absence of heat — it’s just an arbitrary point on the Fahrenheit scale.
The last data type, ratio data, includes a meaningful zero point. For temperatures, the Kelvin scale gives ratio data. One hundred degrees Kelvin is twice as hot as 50 degrees Kelvin. This is because the Kelvin zero point is absolute zero, where all molecular motion (the basis of heat) stops. Another example is a ruler. Eight inches is twice as long as four inches. A length of zero means a complete absence of length.
Any of these data types can form the basis of an independent variable or a dependent variable. The analytical tools you use depend on the type of data you’re dealing with.
A little probability
When statisticians make decisions, they express their confidence about those decisions in terms of probability. They can never be certain about what they decide. They can only tell you how probable their conclusions are.
Читать дальшеИнтервал:
Закладка:
Похожие книги на «Statistical Analysis with Excel For Dummies»
Представляем Вашему вниманию похожие книги на «Statistical Analysis with Excel For Dummies» списком для выбора. Мы отобрали схожую по названию и смыслу литературу в надежде предоставить читателям больше вариантов отыскать новые, интересные, ещё непрочитанные произведения.


Обсуждение, отзывы о книге «Statistical Analysis with Excel For Dummies» и просто собственные мнения читателей. Оставьте ваши комментарии, напишите, что Вы думаете о произведении, его смысле или главных героях. Укажите что конкретно понравилось, а что нет, и почему Вы так считаете.