Distributed Acoustic Sensing in Geophysics
Здесь есть возможность читать онлайн «Distributed Acoustic Sensing in Geophysics» — ознакомительный отрывок электронной книги совершенно бесплатно, а после прочтения отрывка купить полную версию. В некоторых случаях можно слушать аудио, скачать через торрент в формате fb2 и присутствует краткое содержание. Жанр: unrecognised, на английском языке. Описание произведения, (предисловие) а так же отзывы посетителей доступны на портале библиотеки ЛибКат.
- Название:Distributed Acoustic Sensing in Geophysics
- Автор:
- Жанр:
- Год:неизвестен
- ISBN:нет данных
- Рейтинг книги:5 / 5. Голосов: 1
-
Избранное:Добавить в избранное
- Отзывы:
-
Ваша оценка:
Distributed Acoustic Sensing in Geophysics: краткое содержание, описание и аннотация
Предлагаем к чтению аннотацию, описание, краткое содержание или предисловие (зависит от того, что написал сам автор книги «Distributed Acoustic Sensing in Geophysics»). Если вы не нашли необходимую информацию о книге — напишите в комментариях, мы постараемся отыскать её.
Distributed Acoustic Sensing in Geophysics Methods and Applications Distributed Acoustic Sensing (DAS) is a technology that records sound and vibration signals along a fiber optic cable. Its advantages of high resolution, continuous, and real-time measurements mean that DAS systems have been rapidly adopted for a range of applications, including hazard mitigation, energy industries, geohydrology, environmental monitoring, and civil engineering.
presents experiences from both industry and academia on using DAS in a range of geophysical applications. Volume highlights include: The American Geophysical Union promotes discovery in Earth and space science for the benefit of humanity. Its publications disseminate scientific knowledge and provide resources for researchers, students, and professionals.
Distributed Acoustic Sensing in Geophysics — читать онлайн ознакомительный отрывок
Ниже представлен текст книги, разбитый по страницам. Система сохранения места последней прочитанной страницы, позволяет с удобством читать онлайн бесплатно книгу «Distributed Acoustic Sensing in Geophysics», без необходимости каждый раз заново искать на чём Вы остановились. Поставьте закладку, и сможете в любой момент перейти на страницу, на которой закончили чтение.
Интервал:
Закладка:
Under the equation δε = δφ /(2 πnL MI/ λ ), the strain sensitivity is mainly determined by the phase noise δφ and the spatial resolution L MI(defined as the gauge length [Masoudi et al., 2013]). The phase noise is shown in Figure 4.3b, and the average value is around 5 × 10 ‐4rad/√Hz. With the designed spatial resolution L MI= 10 m, the minimum detected strain of this PGC‐DAS system is as small as 8.5 pε/√Hz.
Figure 4.4a displays a waterfall plot of the magnitude response of each channel in the sensing fiber around the fiber stretcher with a sinusoidal signal of 100 Hz. The y ‐axis is proportional to distance along the cable, with a distance increment of 0.4 m, and the color of each cell is proportional to the waveform amplitude. Figure 4.4b shows the superposition result of absolute amplitude of each channel. The signal boundary is defined by the channel of 10% of the absolute peak amplitude. Results show that the sinusoidal signal ranges from Channel #4786 to Channel #4828, and the range is up to 16.8 m. By subtracting the coiled fiber length, the spatial resolution of PGC‐DAS system is about 10.8 m, which is nearly consistent with the optical path difference L MI= 10 m.
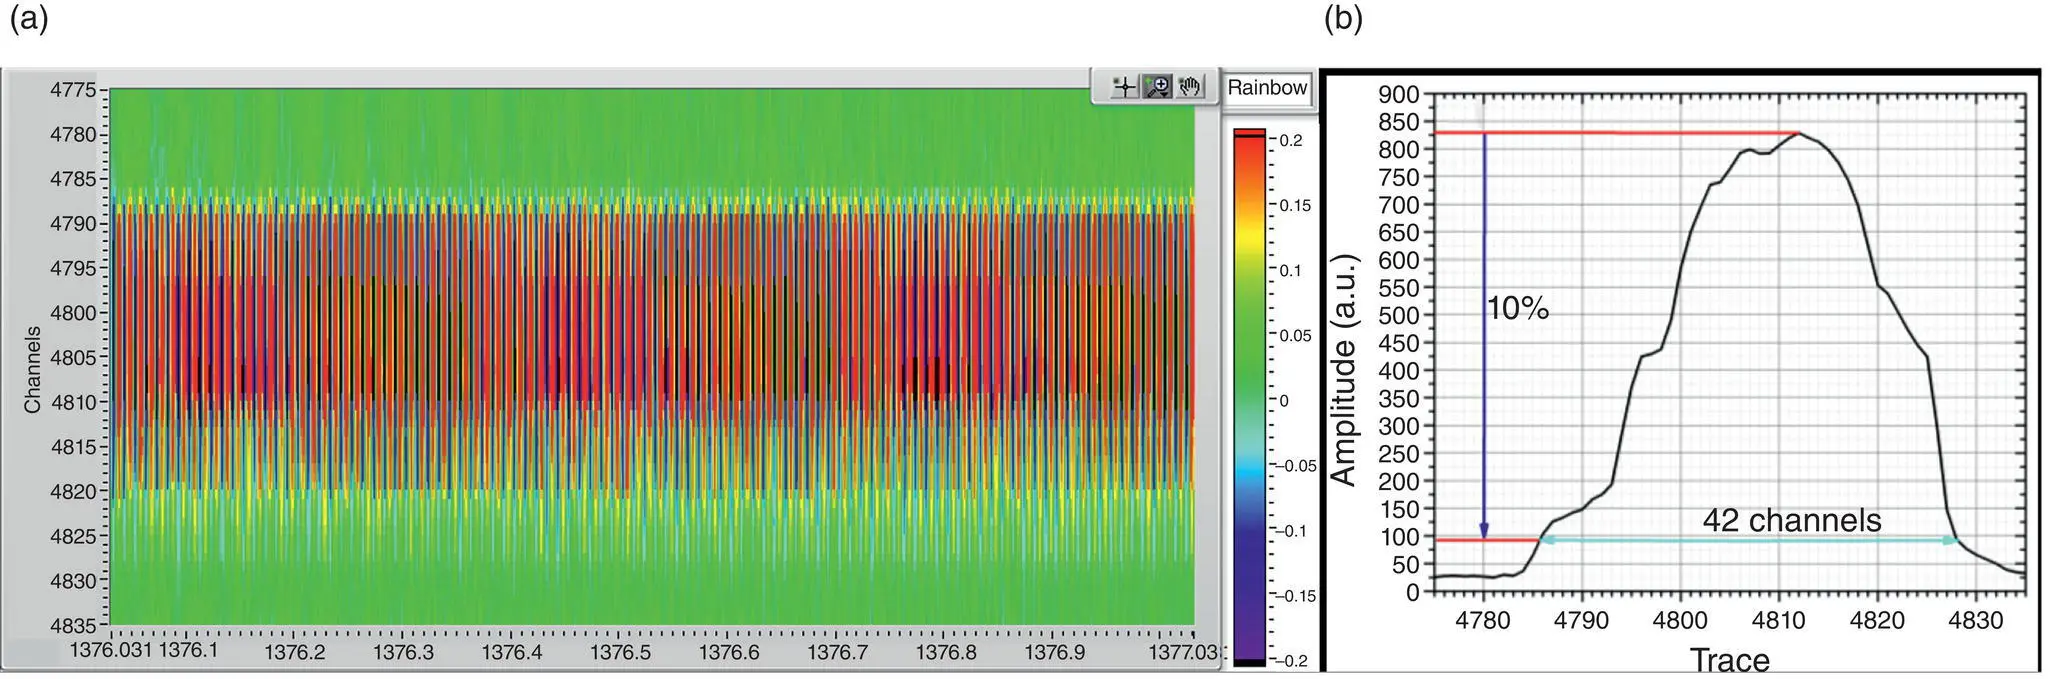
Figure 4.4 Intensity map of demodulation magnitude of each channel: (a) Waterfall plot and (b) superposition absolute magnitude.
Figure 4.5depicts the measurement of frequency response with a linear sweeping frequency signal from 2 Hz to 1 kHz. Each sweeping signal with a constant voltage amplitude of 0.5 Vpp lasts 2 s. Short‐time Fourier transform (STFT) is used to indicate the relative linear and flat frequency response of PGC‐DAS system.
The linearity of PGC‐DAS system is an essential characteristic of quantitative seismic measurement. A sinusoidal strain signal of the fiber stretcher with sweeping voltage from 0.01 Vpp to 1.6 Vpp is used to inspect the amplitude response. The linearity of the strain response is shown in Figure 4.6. From the fitting result, the linear coefficient R 2is 0.99941. An expected linear response capability is presented, and it proves the feasibility of the PGC‐DAS system for the microseismic signal detection.
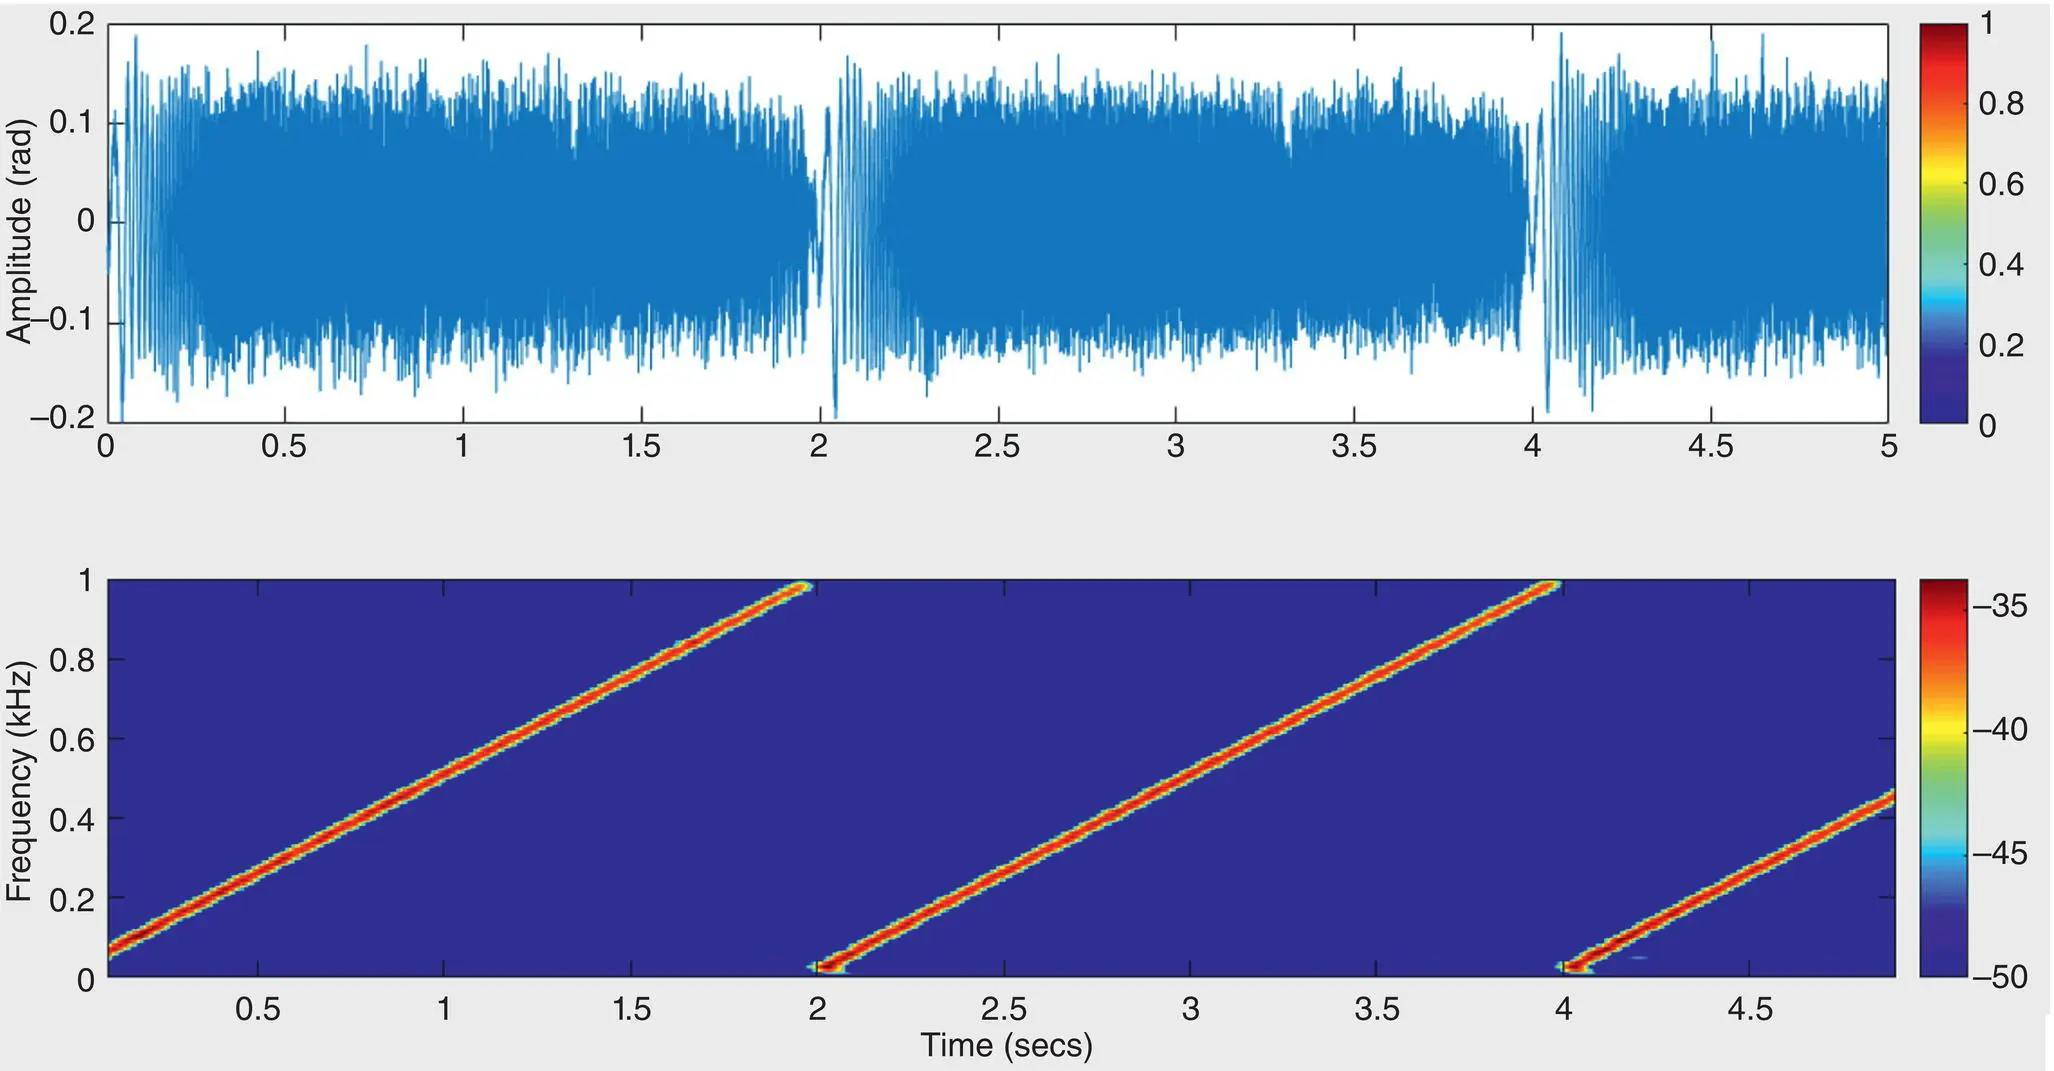
Figure 4.5 Time domain and STFT spectrogram of sweeping frequency signal.
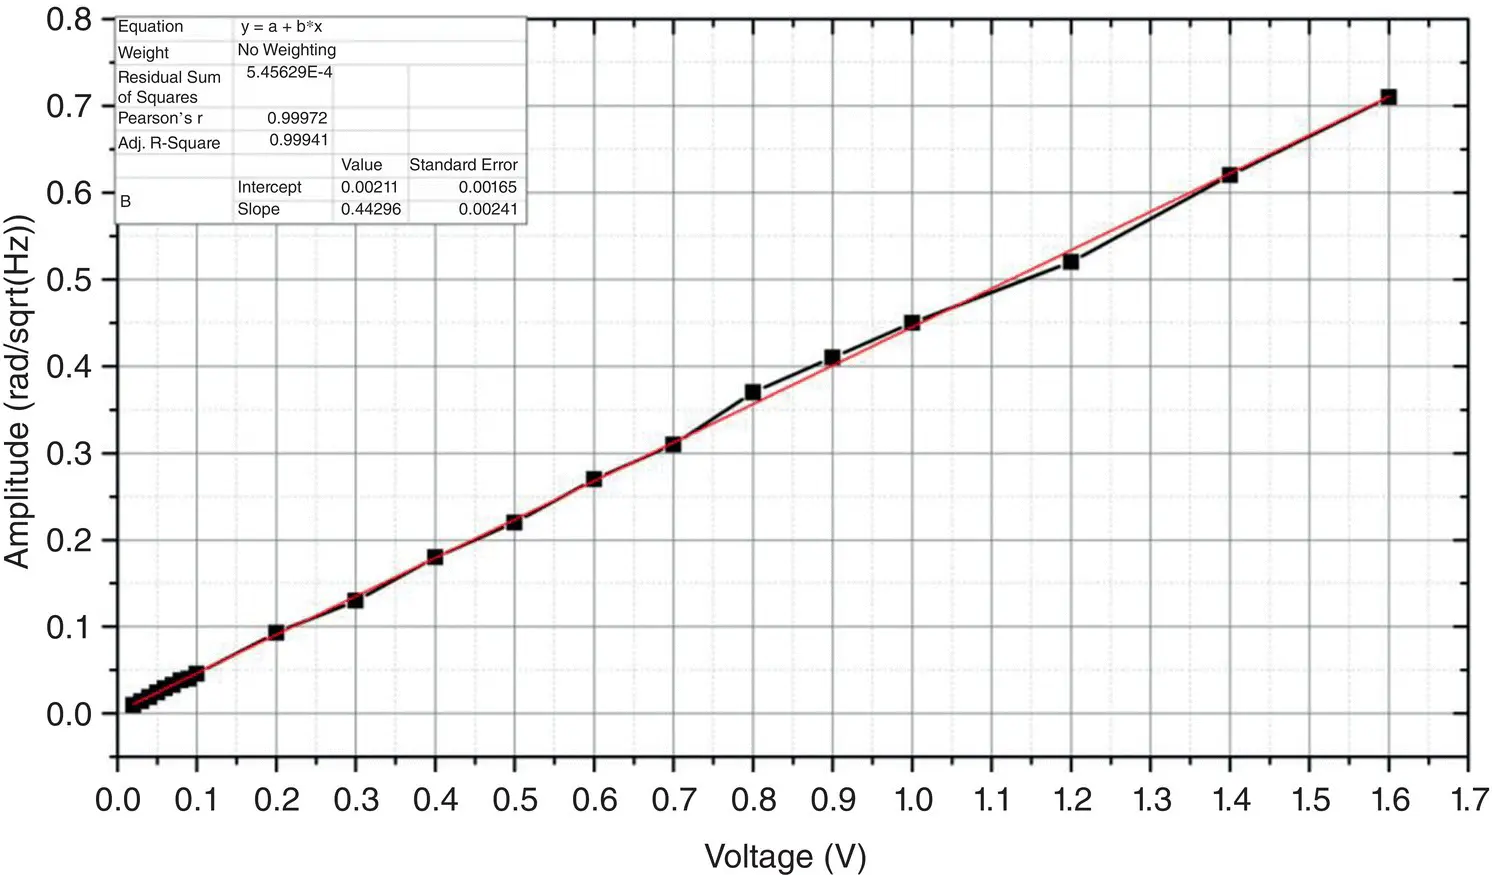
Figure 4.6 Amplitude response curve of PGC‐DAS system.
4.4. FIELD TRIAL OF NEAR‐SURFACE SEISMIC EXPERIMENT WITH PGC‐DAS SYSTEM
A near‐surface seismic experiment based on fiber optic cables and PGC‐DAS system was conducted in Hebei Province, China. On the site, a 7 mm diameter fiber optic cable ( Figure 4.7d) of about 430 m was buried in an approximate L shape at 0.4 m depth with a 230 m cable in Line 1 and a 200 m cable in Line 2 ( Figures 4.7a and 4.7b). PGC‐DAS system was connected at one end of the fiber optic cable to record multichannel seismic data at a sampling rate of 2 kHz with a spatial sampling interval of 1 m. For comparison, 80 conventional three‐component (3C) geophones ( Figure 4.7c) were buried along the cable with an interval of around 5 m. A vibroseis truck was employed as an active source at seven designed positions (P1, P2, P3, P4, P5, P6, and P7) around the fiber optic cable to investigate directivity, since optical fiber is mostly sensitive to axial strain along the fiber and lacks broadside sensitivity due to its silica glass nature.
Figure 4.8shows multichannel seismic recordings of PGC‐DAS system and geophone array in Line 1 at active source position #1. Since axial is the most sensitive direction of the fiber, the data of a 3C geophone for x ‐component were used. Both 40 channels’ recordings for DAS system and geophones’ array with the same interval of 5 m at similar positions were selected. Difference of seismic first arrivals’ time between those two systems is due to trigger unsynchronization. DAS data were qualitatively similar to the signals observed on the geophones. Both direct wave and surface were clearly presented. However, there was apparently isolated noise in DAS data before the first arrivals (e.g., in Channels of 11, 151, and 161) due to interference fading. Simple contrast shows that this PGC‐DAS system can provide reliable information to image and explore the shallow subsurface under this fiber cable.
4.5. CONCLUSIONS
We propose a real‐time DAS system based on PGC demodulation algorithm. Compared with the previous work (Fang et al., 2015), it brings a 15.6 dB improvement in phase noise. The average noise could reach ~5 × 10 ‐4rad/√Hz, and the strain sensitivity is as small as 8.5 pε/√Hz for a 10 m spatial resolution. This PGC‐DAS system could measure the dynamic vibration signal from 2 Hz to 1 kHz over a 10 km long optical fiber, with a linear coefficient R 2of 0.99941 and a minimum spatial interval of 0.4 m. The near‐surface seismic experimental results show that DAS data are qualitatively similar to the signals observed on the geophones. These facts suggest that DAS technology provides a novel and highly valuable tool for geophysical science in a wider sense. Moreover, PGC‐DAS system has potential advantages in reducing size and power consumption due to simple structure and efficient phase demodulation algorithm, and a mini‐PGC‐DAS module is under development, with a size of 150 mm × 300 mm × 110 mm (width × depth × height) and a power consumption of 25 W, which could work at the bottom for submarine application.
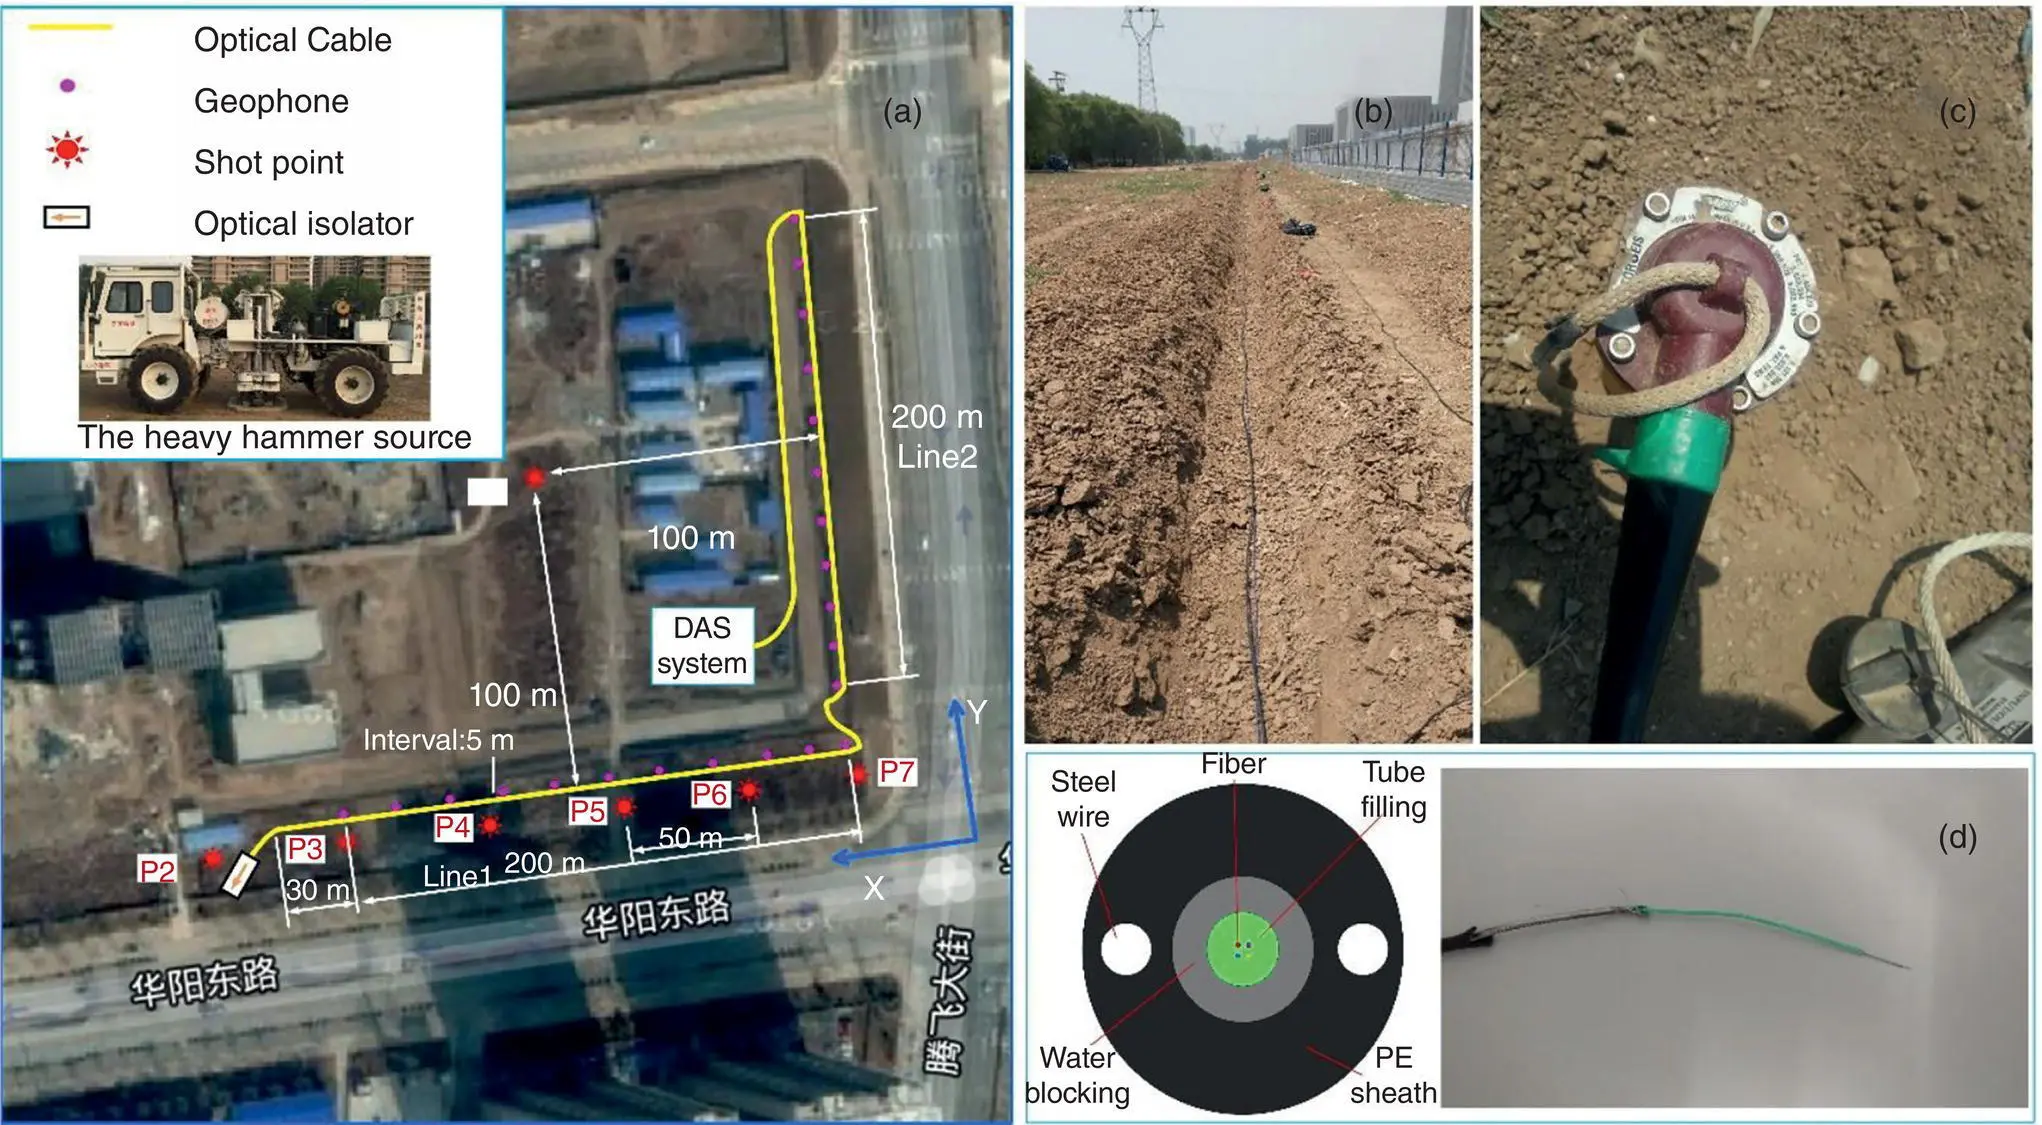
Figure 4.7 Field trial of near‐surface seismic experiment. (a) Plan view of experimental layout, (b) photo of the buried fiber optic cable, (c) photo of a 3C geophone, and (d) structure of the fiber optic cable.
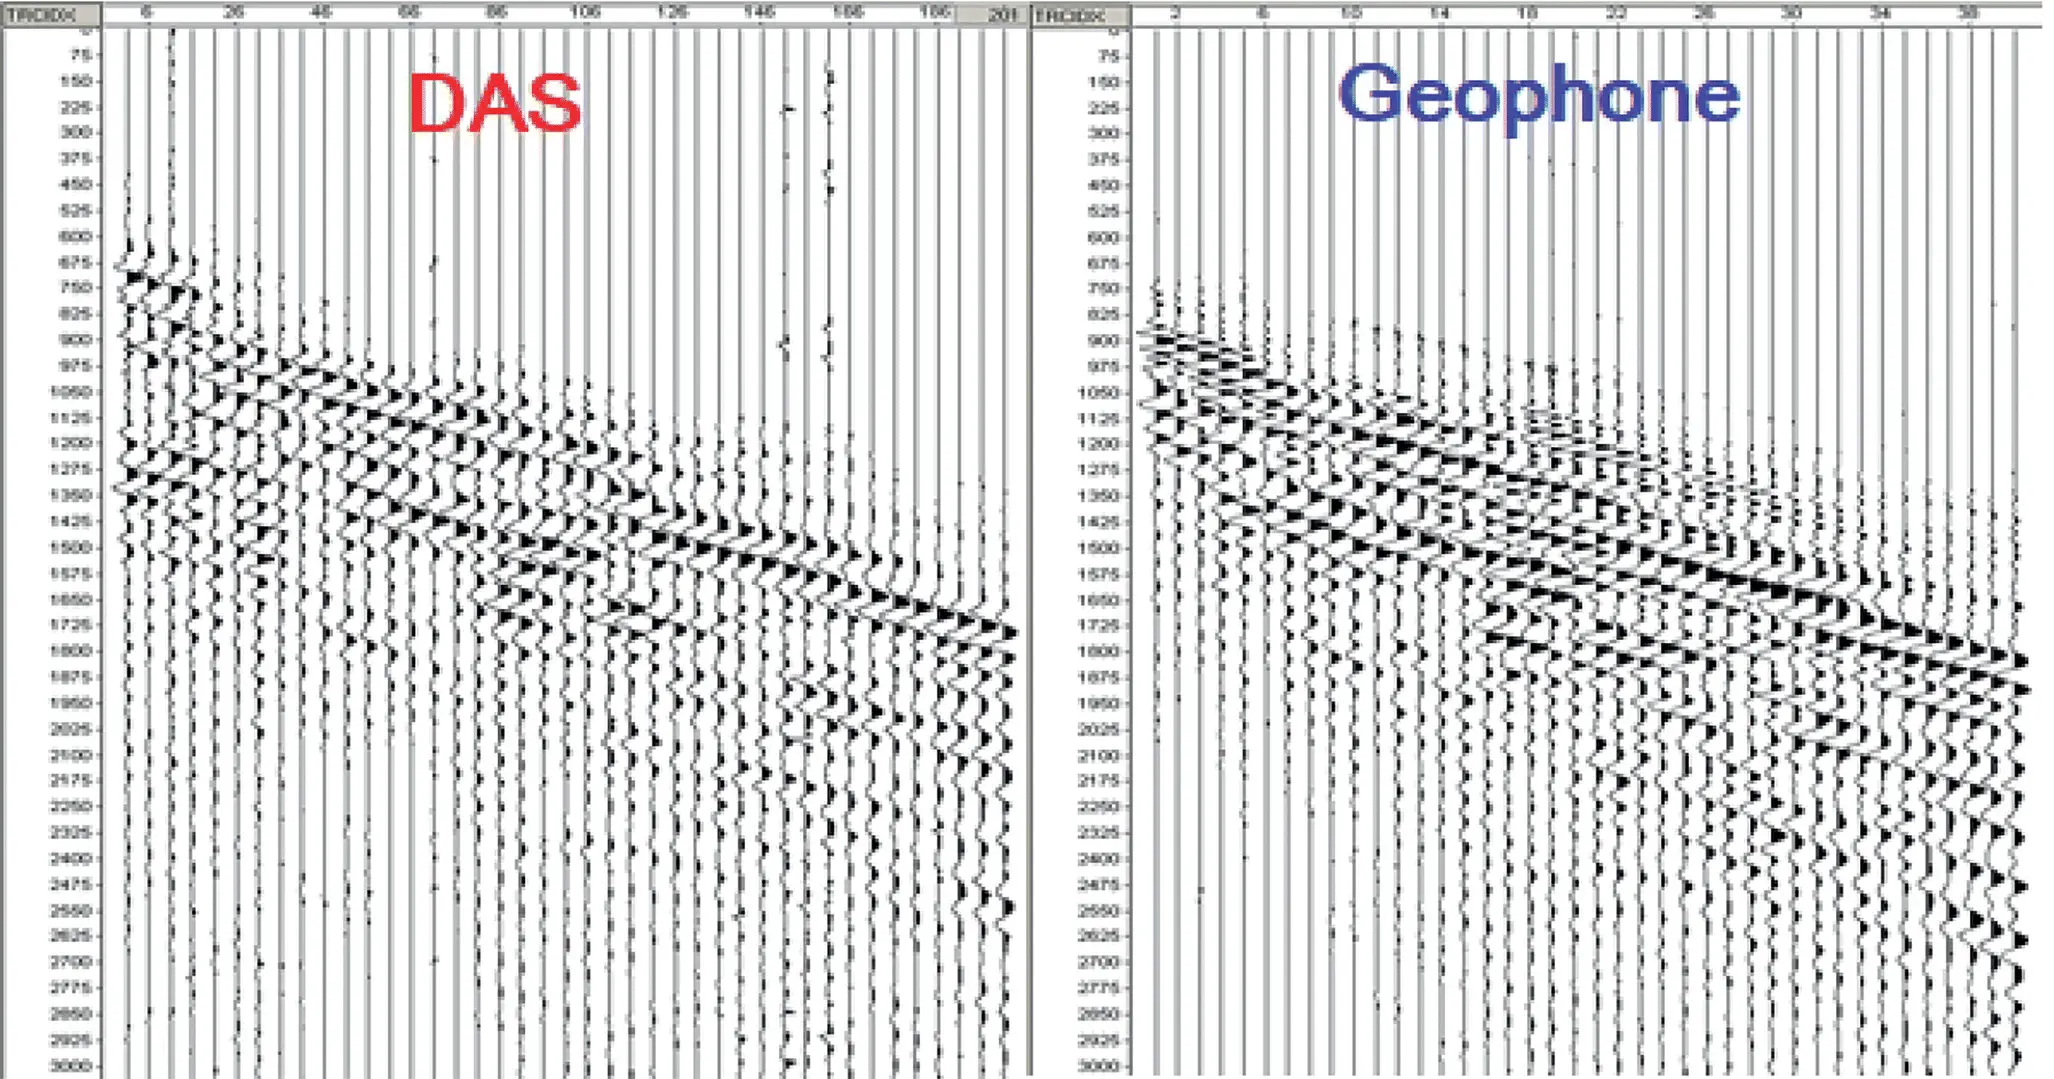
Figure 4.8 Initial data of DAS system and geophone array for x ‐component at P1 in Line 1.
ACKNOWLEDGMENTS
This work was funded by the National Natural Science Foundation of China (Grant Nos. 61875184 and 61775210), the National Key Research and Development Program of China (Grant No. 2017YFB0405500), the Strategic Priority Research Program of the Chinese Academy of Sciences (Grant Nos. XDC02040500 and XDA22040105), and State Key Laboratory of Geodesy and Earth’s Dynamics, Institute of Geodesy and Geophysics, Chinese Academy of Sciences (Grant No. SKLGED2019‐5‐4‐E).
REFERENCES
1 Alekseev, A. E., Vdovenko, V. S., Gorshkov, B. G., Potapov, V. T., & Sergachev, I. A. (2014a). A phase‐sensitive optical time‐domain reflectometer with dual‐pulse phase modulated probe signal. Laser Physics, 24(5).
2 Alekseev, A. E., Vdovenko, V. S., Gorshkov, B. G., Potapov, V. T., & Sergachev, I. A. (2014b). Phase‐sensitive optical coherence reflectometer with differential phase‐shift keying of probe pulses. Quantum Electronics, 44(10), 965–969.
Читать дальшеИнтервал:
Закладка:
Похожие книги на «Distributed Acoustic Sensing in Geophysics»
Представляем Вашему вниманию похожие книги на «Distributed Acoustic Sensing in Geophysics» списком для выбора. Мы отобрали схожую по названию и смыслу литературу в надежде предоставить читателям больше вариантов отыскать новые, интересные, ещё непрочитанные произведения.


Обсуждение, отзывы о книге «Distributed Acoustic Sensing in Geophysics» и просто собственные мнения читателей. Оставьте ваши комментарии, напишите, что Вы думаете о произведении, его смысле или главных героях. Укажите что конкретно понравилось, а что нет, и почему Вы так считаете.