Distributed Acoustic Sensing in Geophysics
Здесь есть возможность читать онлайн «Distributed Acoustic Sensing in Geophysics» — ознакомительный отрывок электронной книги совершенно бесплатно, а после прочтения отрывка купить полную версию. В некоторых случаях можно слушать аудио, скачать через торрент в формате fb2 и присутствует краткое содержание. Жанр: unrecognised, на английском языке. Описание произведения, (предисловие) а так же отзывы посетителей доступны на портале библиотеки ЛибКат.
- Название:Distributed Acoustic Sensing in Geophysics
- Автор:
- Жанр:
- Год:неизвестен
- ISBN:нет данных
- Рейтинг книги:5 / 5. Голосов: 1
-
Избранное:Добавить в избранное
- Отзывы:
-
Ваша оценка:
Distributed Acoustic Sensing in Geophysics: краткое содержание, описание и аннотация
Предлагаем к чтению аннотацию, описание, краткое содержание или предисловие (зависит от того, что написал сам автор книги «Distributed Acoustic Sensing in Geophysics»). Если вы не нашли необходимую информацию о книге — напишите в комментариях, мы постараемся отыскать её.
Distributed Acoustic Sensing in Geophysics Methods and Applications Distributed Acoustic Sensing (DAS) is a technology that records sound and vibration signals along a fiber optic cable. Its advantages of high resolution, continuous, and real-time measurements mean that DAS systems have been rapidly adopted for a range of applications, including hazard mitigation, energy industries, geohydrology, environmental monitoring, and civil engineering.
presents experiences from both industry and academia on using DAS in a range of geophysical applications. Volume highlights include: The American Geophysical Union promotes discovery in Earth and space science for the benefit of humanity. Its publications disseminate scientific knowledge and provide resources for researchers, students, and professionals.
Distributed Acoustic Sensing in Geophysics — читать онлайн ознакомительный отрывок
Ниже представлен текст книги, разбитый по страницам. Система сохранения места последней прочитанной страницы, позволяет с удобством читать онлайн бесплатно книгу «Distributed Acoustic Sensing in Geophysics», без необходимости каждый раз заново искать на чём Вы остановились. Поставьте закладку, и сможете в любой момент перейти на страницу, на которой закончили чтение.
Интервал:
Закладка:
In addition to weighted stacking of the sweeps, another approach can be used when acquiring data. The response of the fiber to fading depends on the frequency of the laser light used. If two or more different frequencies of light are used to simultaneously acquire the same strain measurements in the fiber, the locations of the fading will most likely be different because of the disparate frequency sensitivities of the light to the scattering points in the fiber. Figure 2.7shows the VSP strain rate data sets acquired using two frequencies. Figures 2.7a and 2.7b show the records using frequencies 1 and 2, respectively—notice that the locations of the fading are different between the two records. Figure 2.7c shows the result of the weighted stacking of data from two frequencies. A significant reduction in the number of faded channels can be observed by combining data acquired with more than one frequency of light. For clarity, Figure 2.7d shows the three traces (frequency 1, frequency 2, and weighted stack) for each of two channel locations (109 and 221). For channel 109, the frequency 1 data (in red) is faded; and, for channel 221, the frequency 2 data (in red) is faded. Thus, the weighted stack (in black) favors the non‐faded trace (in blue).
2.5.2. Common‐Mode Noise
The entire length of fiber from the IU to the end of the sensing fiber responds to any sound‐imparting strain on the optical fiber; further, the IU is sensitive to sound. All sounds hitting the IU impose an unwanted signal simultaneously on all data channels. This unwanted signal is called “common‐mode noise” or “horizontal noise,” because it appears as horizontal streaks on the data record. Therefore, it is important to consider keeping the area surrounding the IU quiet and, ideally, isolated from ground motion using a vibration‐isolation table. Even with sound isolation, it is still likely that the derived strain rate data will exhibit common‐mode noise.

Figure 2.6 Strain rate VSP data collected with a vibrator – (top row) uncorrelated trace without fading; (second row) uncorrelated trace with fading between 10 and 12 s; (third row) corresponding correlated trace without fading; and (fourth row) corresponding correlated trace with fading.
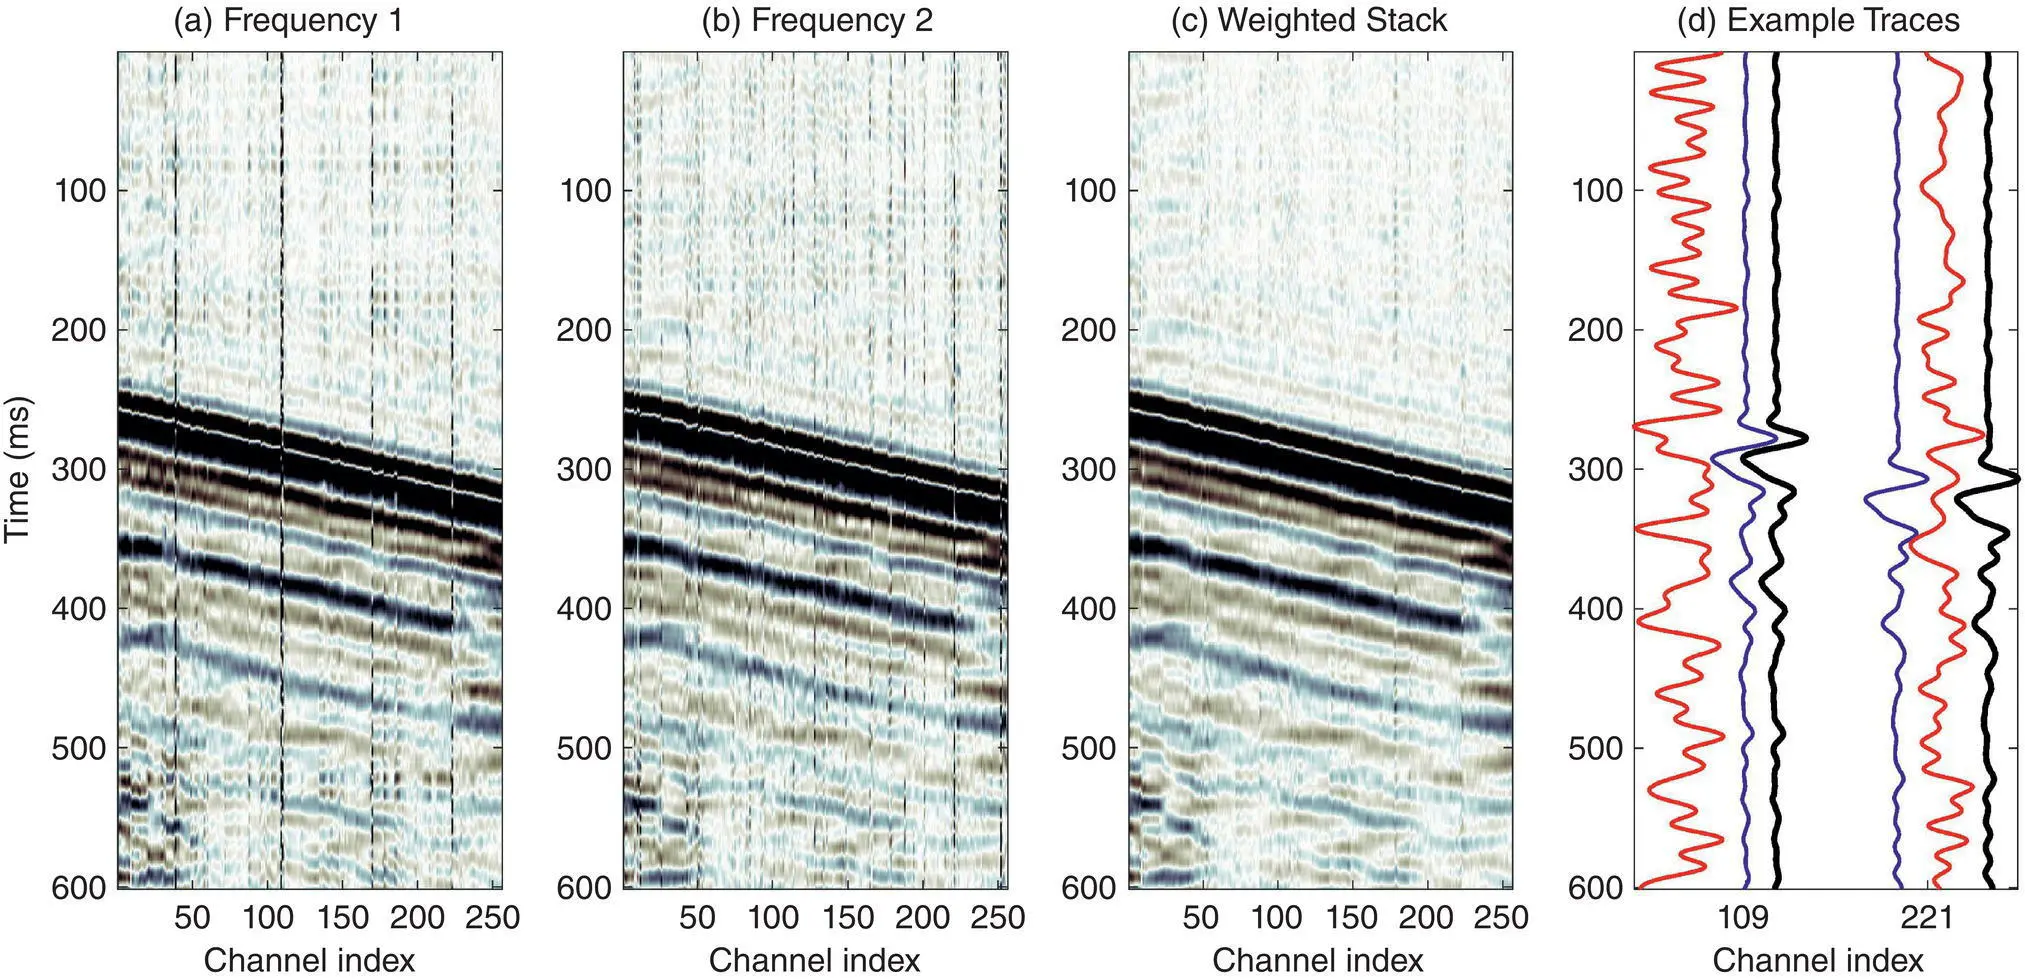
Figure 2.7 (a) single sweep using Frequency 1 – note the prominent fading at channels 38, 109, 169, and 223; (b) single sweep using Frequency 2 – note the prominent fading at channels 9, 128, 221, and 252; (c) weighted stack of data from both frequencies – note the strong reduction in fading; and (d) corresponding traces for channels 109 and 221, where the red trace is the faded trace, the blue is not faded, and the black trace is the weighted stack.
Figure 2.8(left) shows a record exhibiting common‐mode noise, which is the horizontal noise that stripes across all channels. Figure 2.8(right) shows the same record after signal processing has been applied to remove the common‐mode noise. An estimate of the noise can be created by stacking together all the traces in the record. As long as the actual desired seismic signal is changing significantly across the traces, the seismic signal will cancel itself, and only the common‐mode noise will remain in the stack. This stacked trace, normalized by the number of traces in the record, is then subtracted from each trace in the record to obtain the denoised record.
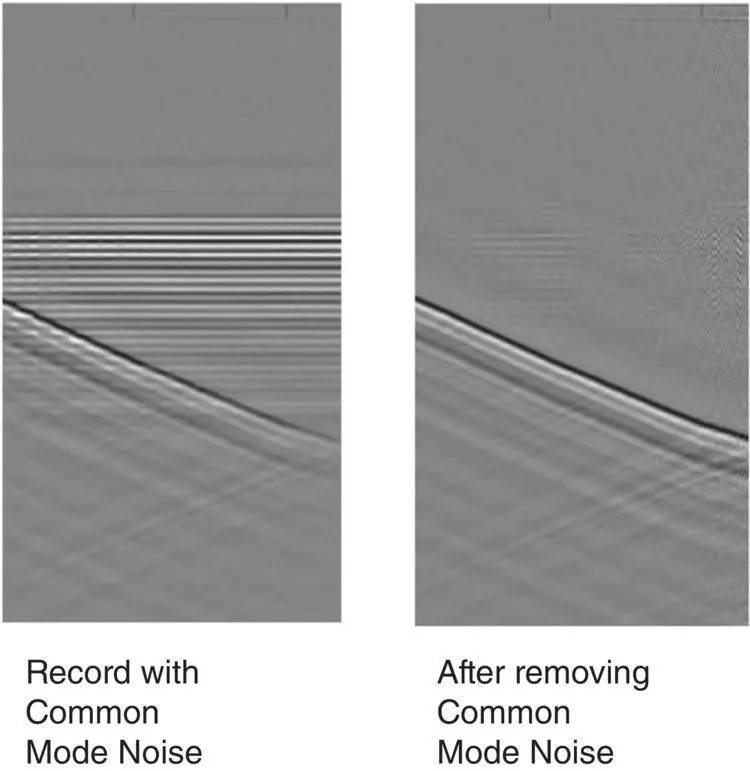
Figure 2.8 (Left) Strain rate record showing common‐mode noise; (right) same record following common‐mode noise removal.
2.5.3. Spatial Calibration of Channels
For conventional seismic acquisition methodologies using geophones, accelerometers, or seismometers, the location of each sensor is determined by conventional surveying techniques for surface instruments or wireline depth measurement technology for instruments deployed in wells. Fiber‐optic cables pose a new challenge because the glass is distributed continuously over the entire cable, and the location of each measured channel is not specifically recorded, even though the trajectory of the cable might be surveyed accurately. A feature of fiber‐optic cables is that a longer length of glass fiber is deliberately overly stuffed into its protective outer cable, so the glass fiber does not break when the cable is put under tension and stretched.
To first order, the location of each channel of DAS data can be estimated by the time of flight of the laser light. The velocity v of light for each type of fiber is fairly accurately known. The delay between the time the laser light is pulsed into the fiber and the time the backscattered light reaches the detector is known as the “time of flight” τ. This is the two‐way time it takes the light to leave the laser, backscatter off a point in the fiber, and return to the detector; thus, the distance z along the fiber where the backscattering point is located is given by:
(2.3) 
Other factors to consider are the lengths of optical cabling inside the IU and the surface cables connecting the IU to the beginning of the optical cable meant as the sensing cable, either in a well or buried in a trench or conduit. Additionally, it is possible the sensing cable might have been cut and spliced with extra cable inserted but not accounted for. These factors, including the potential uncertainty of the velocity of light in the fiber, make Equation 2.3only an approximate solution to determining the depth or location of each DAS channel of data.
A practical solution to the spatial calibration of each channel issue is to use control points along the fiber where the location and/or depth of that point is known; for example, the location of the end of the fiber is recorded by the cable installer. Optically, it is easy to detect the end of the fiber from the lack of backscattered energy returning to the detector after a light pulse is emitted into the cable. By looking at the recorded DAS strain or strain rate data, the last channel after which there is no coherent data is easy to select as the end of the fiber and therefore can be mapped to the known location of the end of the fiber. The beginning of the sensing fiber can be located by a “tap” test at, for example, the wellhead for well‐based applications, or at the location where the surface cable connects to the sensing fiber in a buried trench or telecommunications conduit. For shallow‐buried fiber cables, additional tap tests can be combined with GPS measurements to obtain an accurate calibration of location of the channels.
Alternatively, an optical time domain reflectometer (OTDR) can be used to detect the end of the fiber and points along the fiber where it has been spliced. An OTDR detects the overall health of a fiber by estimating the light attenuation in the fiber, and it detect points where there are large losses, such as at splice points and cable terminations. If the cable installer recorded splice point locations (e.g., at the wellhead or at locations of pressure or temperature sensors), then they can be used as additional known locations along the fiber associated with the corresponding channels in DAS data. The depth or location along the fiber of each intermediate channel can then be interpolated between the known control points.
Читать дальшеИнтервал:
Закладка:
Похожие книги на «Distributed Acoustic Sensing in Geophysics»
Представляем Вашему вниманию похожие книги на «Distributed Acoustic Sensing in Geophysics» списком для выбора. Мы отобрали схожую по названию и смыслу литературу в надежде предоставить читателям больше вариантов отыскать новые, интересные, ещё непрочитанные произведения.


Обсуждение, отзывы о книге «Distributed Acoustic Sensing in Geophysics» и просто собственные мнения читателей. Оставьте ваши комментарии, напишите, что Вы думаете о произведении, его смысле или главных героях. Укажите что конкретно понравилось, а что нет, и почему Вы так считаете.