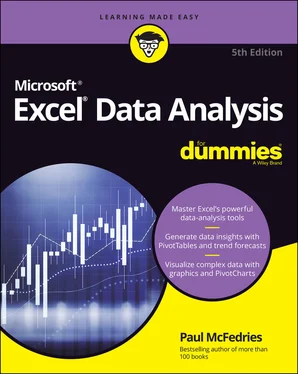
Paul McFedries - Excel Data Analysis For Dummies
Здесь есть возможность читать онлайн «Paul McFedries - Excel Data Analysis For Dummies» — ознакомительный отрывок электронной книги совершенно бесплатно, а после прочтения отрывка купить полную версию. В некоторых случаях можно слушать аудио, скачать через торрент в формате fb2 и присутствует краткое содержание. Жанр: unrecognised, на английском языке. Описание произведения, (предисловие) а так же отзывы посетителей доступны на портале библиотеки ЛибКат.
- Название:Excel Data Analysis For Dummies
- Автор:
- Жанр:
- Год:неизвестен
- ISBN:нет данных
- Рейтинг книги:5 / 5. Голосов: 1
-
Избранное:Добавить в избранное
- Отзывы:
-
Ваша оценка:
- 100
- 1
- 2
- 3
- 4
- 5
Excel Data Analysis For Dummies: краткое содержание, описание и аннотация
Предлагаем к чтению аннотацию, описание, краткое содержание или предисловие (зависит от того, что написал сам автор книги «Excel Data Analysis For Dummies»). Если вы не нашли необходимую информацию о книге — напишите в комментариях, мы постараемся отыскать её.
Excel Data Analysis For Dummies
Excel Data Analysis For Dummies
Excel Data Analysis For Dummies — читать онлайн ознакомительный отрывок
Ниже представлен текст книги, разбитый по страницам. Система сохранения места последней прочитанной страницы, позволяет с удобством читать онлайн бесплатно книгу «Excel Data Analysis For Dummies», без необходимости каждый раз заново искать на чём Вы остановились. Поставьте закладку, и сможете в любой момент перейти на страницу, на которой закончили чтение.
Интервал:
Закладка:
Updates: If this book has any updates after printing, they will be posted to this book's page at www.dummies.com .
Where to Go from Here
If you’re just getting your feet wet with Excel data analysis, flip the page and start perusing the first chapter.
If you have some experience with Excel data analysis or you have a special problem or question, use the Table of Contents or the index to find out where I cover that topic and then turn to that page.
Either way, happy analyzing!
Part 1
Getting Started with Data Analysis
IN THIS PART …
Understand data analysis and get to know basic analysis features such as conditional formatting and subtotals.
Discover Excel’s built-in tools for analyzing data.
Learn how to build Excel tables that hold and store the data you need to analyze.
Find quick and easy ways to begin your analysis using simple statistics, sorting, and filtering.
Get practical stratagems and common-sense tactics for grabbing data from extra sources.
Chapter 1
Learning Basic Data-Analysis Techniques
IN THIS CHAPTER
 Learning about data analysis
 Analyzing data by applying conditional formatting
 Adding subtotals to summarize data
 Grouping related data
 Combining data from multiple worksheets
You are awash in data. Information multiplies around you so fast that you wonder how to make sense of it all. You think, “I know what to do. I'll paste the data into Excel. That way, at least the data will be nicely arranged in the worksheet cells, and I can add a little formatting to make things somewhat palatable.” That’s a fine start, but you’re often called upon to do more with your data than make it merely presentable. Your boss, your customer, or perhaps just your curiosity requires you to divine some inner meaning from the jumble of numbers and text that litter your workbooks. In other words, you need to analyze your data to see what nuggets of understanding you can unearth.
This chapter gets you started down that data-analysis path by exploring a few straightforward but useful analytic techniques. After discovering what data analysis entails, you investigate a number of Excel data-analysis techniques, including conditional formatting, data bars, color scales, and icon sets. From there, you dive into some useful methods for summarizing your data, including subtotals, grouping, and consolidation. Before you know it, that untamed wilderness of a worksheet will be nicely groomed and landscaped.
What Is Data Analysis, Anyway?
Are you wondering, “What is data analysis, anyway?” That’s an excellent question! Here’s an answer that I unpack for you as I go along: Data analysis is the application of tools and techniques to organize, study, reach conclusions, and sometimes make predictions about a specific collection of information.
For example, a sales manager might use data analysis to study the sales history of a product, determine the overall trend, and produce a forecast of future sales. A scientist might use data analysis to study experimental findings and determine the statistical significance of the results. A family might use data analysis to find the maximum mortgage it can afford or how much it must put aside each month to finance retirement or the kids’ education.
Cooking raw data
The point of data analysis is to understand information on some deeper, more meaningful level. By definition, raw data is a mere collection of facts that by themselves tell you little or nothing of any importance. To gain some understanding of the data, you must manipulate the data in some meaningful way. The purpose of manipulating data can be something as simple as finding the sum or average of a column of numbers or as complex as employing a full-scale regression analysis to determine the underlying trend of a range of values. Both are examples of data analysis, and Excel offers a number of tools — from the straightforward to the sophisticated — to meet even the most demanding needs.
Dealing with data
The data part of data analysis is a collection of numbers, dates, and text that represents the raw information you have to work with. In Excel, this data resides inside a worksheet, which makes the data available for you to apply Excel’s satisfyingly large array of data-analysis tools.
Most data-analysis projects involve large amounts of data, and the fastest and most accurate way to get that data onto a worksheet is to import it from a non-Excel data source. In the simplest scenario, you can copy the data from a text file, a Word table, or an Access datasheet and then paste it into a worksheet. However, most business and scientific data is stored in large databases, so Excel offers tools to import the data you need into your worksheet. I talk about all this in more detail later in the book.
After you have your data in the worksheet, you can use the data as is to apply many data-analysis techniques. However, if you convert the range into a table, Excel treats the data as a simple database and enables you to apply a number of database-specific analysis techniques to the table.
Building data models
In many cases, you perform data analysis on worksheet values by organizing those values into a data model, a collection of cells designed as a worksheet version of some real-world concept or scenario. The model includes not only the raw data but also one or more cells that represent some analysis of the data. For example, a mortgage amortization model would have the mortgage data — interest rate, principal, and term — and cells that calculate the payment, principal, and interest over the term. For such calculations, you use formulas and Excel’s built-in worksheet functions.
Performing what-if analysis
One of the most common data-analysis techniques is what-if analysis, for which you set up worksheet models to analyze hypothetical situations. The “what-if” part means that these situations usually come in the form of a question: “What happens to the monthly payment if the interest rate goes up by 2 percent?” “What will the sales be if you increase the advertising budget by 10 percent?” Excel offers four what-if analysis tools: data tables, Goal Seek, Solver, and scenarios, all of which I cover in this book.
Analyzing Data with Conditional Formatting
Many Excel worksheets contain hundreds of data values. You could try to make sense of such largish sets of data by creating complex formulas and wielding Excel’s powerful data-analysis tools. However, just as you wouldn’t use a steamroller to crush a tin can, sometimes these sophisticated techniques are too much tool for the job. For example, what if all you want are answers to simple questions such as the following:
Which cell values are less than 0?
Читать дальшеИнтервал:
Закладка:
Похожие книги на «Excel Data Analysis For Dummies»
Представляем Вашему вниманию похожие книги на «Excel Data Analysis For Dummies» списком для выбора. Мы отобрали схожую по названию и смыслу литературу в надежде предоставить читателям больше вариантов отыскать новые, интересные, ещё непрочитанные произведения.
Обсуждение, отзывы о книге «Excel Data Analysis For Dummies» и просто собственные мнения читателей. Оставьте ваши комментарии, напишите, что Вы думаете о произведении, его смысле или главных героях. Укажите что конкретно понравилось, а что нет, и почему Вы так считаете.
