Michael Alexander - Excel Power Pivot & Power Query For Dummies
Здесь есть возможность читать онлайн «Michael Alexander - Excel Power Pivot & Power Query For Dummies» — ознакомительный отрывок электронной книги совершенно бесплатно, а после прочтения отрывка купить полную версию. В некоторых случаях можно слушать аудио, скачать через торрент в формате fb2 и присутствует краткое содержание. Жанр: unrecognised, на английском языке. Описание произведения, (предисловие) а так же отзывы посетителей доступны на портале библиотеки ЛибКат.
- Название:Excel Power Pivot & Power Query For Dummies
- Автор:
- Жанр:
- Год:неизвестен
- ISBN:нет данных
- Рейтинг книги:5 / 5. Голосов: 1
-
Избранное:Добавить в избранное
- Отзывы:
-
Ваша оценка:
Excel Power Pivot & Power Query For Dummies: краткое содержание, описание и аннотация
Предлагаем к чтению аннотацию, описание, краткое содержание или предисловие (зависит от того, что написал сам автор книги «Excel Power Pivot & Power Query For Dummies»). Если вы не нашли необходимую информацию о книге — напишите в комментариях, мы постараемся отыскать её.
Excel PowerPivot & Power Query For Dummies
Excel PowerPivot & Power Query For Dummies
Excel Power Pivot & Power Query For Dummies — читать онлайн ознакомительный отрывок
Ниже представлен текст книги, разбитый по страницам. Система сохранения места последней прочитанной страницы, позволяет с удобством читать онлайн бесплатно книгу «Excel Power Pivot & Power Query For Dummies», без необходимости каждый раз заново искать на чём Вы остановились. Поставьте закладку, и сможете в любой момент перейти на страницу, на которой закончили чтение.
Интервал:
Закладка:
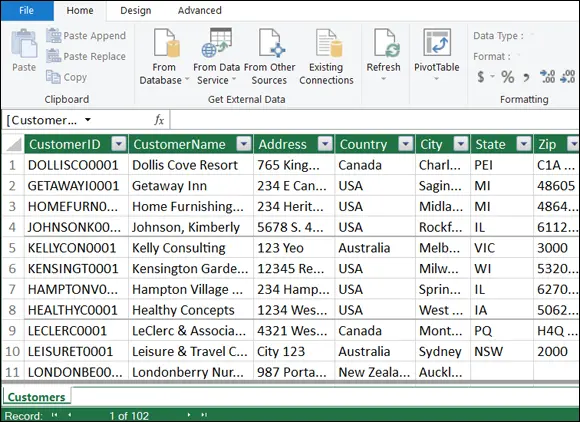
FIGURE 2-5:The Power Pivot window shows all the data that exists in your data model.
Repeat Steps 1 and 2 in the preceding list for your other Excel tables: InvoiceHeader, InvoiceDetails. After you’ve imported all your Excel tables into the data model, the Power Pivot window will show each data set on its own tab, as shown in Figure 2-6.
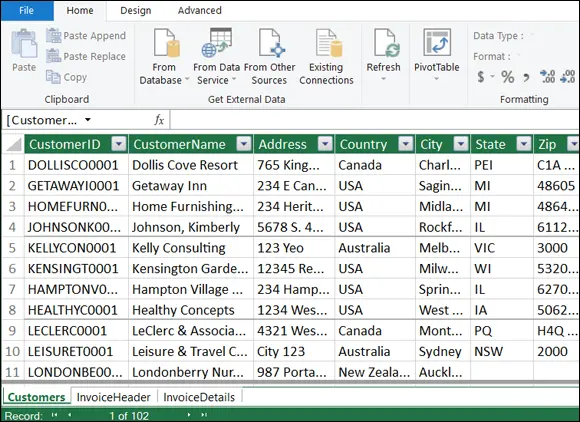
FIGURE 2-6:Each table you add to the data model is placed on its own tab in Power Pivot.
 Because the data you just imported into Power Pivot comes from an Excel table within the current workbook, Power Pivot will consider these linked tables. So, even though the data shown in Power Pivot is a snapshot at the time you added it, the data automatically updates when you edit the source table in Excel. Linked tables are the only kind of data source that automatically refreshes as the data within changes.
Creating relationships between Power Pivot tables
At this point, Power Pivot knows that you have three tables in the data model but has no idea how the tables relate to one another. You connect these tables by defining relationships between the Customers, Invoice Details, and Invoice Header tables. You can do so directly within the Power Pivot window.
 If you’ve inadvertently closed the Power Pivot window, you can easily reopen it by clicking the Manage command button on the Power Pivot Ribbon tab.
Follow these steps to create relationships between your tables:
1 Activate the Power Pivot window and click the Diagram View command button on the Home tab.The Power Pivot screen you see shows a visual representation of all tables in the data model, as shown in Figure 2-7. You can move the tables in Diagram view by simply clicking and dragging them.The idea is to identify the primary index keys in each table and connect them. In this scenario, the Customers table and the Invoice Header table can be connected using the CustomerID field. The Invoice Header and Invoice Details tables can be connected using the InvoiceNumber field. FIGURE 2-7:Diagram view allows you to see all tables in the data model.
2 Click and drag a line from the CustomerID field in the Customers table to the CustomerID field in the Invoice Header table, as demonstrated in Figure 2-8.
3 Click and drag a line from the InvoiceNumber field in the Invoice Header table to the InvoiceNumber field in the Invoice Details table.
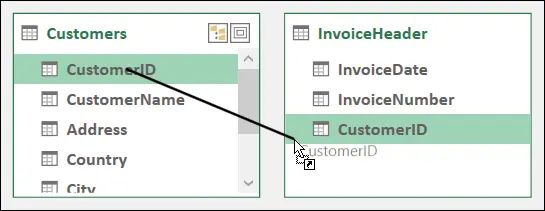
FIGURE 2-8:To create a relationship, you simply click and drag a line between the fields in your tables.
At this point, your diagram will look similar to Figure 2-9. Notice that Power Pivot shows a line between the tables you just connected. In database terms, these are referred to as joins.
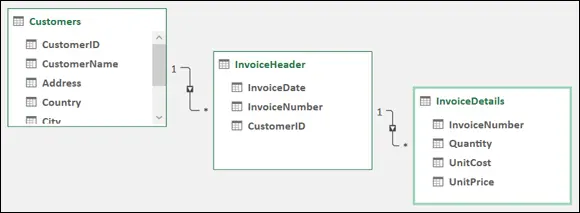
FIGURE 2-9:When you create relationships, the Power Pivot diagram shows join lines between tables.
The joins in Power Pivot are always one-to-many joins. This means that when a table is joined to another, one of the tables has unique records with unique index numbers (CustomerID for example), while the other can have many records where index numbers are duplicated.
Notice in Figure 2-9 that the join lines have arrows pointing from a table to another table. The arrows in these join lines will always point to the table that has the duplicated index. In this case, the Customers table contains a unique list of customers, each having its own unique identifier. No CustomerID in that table is duplicated. The Invoice header table has many rows for each CustomerID; each customer can have many invoices.
To close the diagram and return to seeing the data tables, click the Data View command in the Power Pivot window.
Managing existing relationships
If you need to edit or delete a relationship between two tables in your data model, you can do so by following these steps:
1 Open the Power Pivot window, select the Design tab, and then select the Manage Relationships command.
2 In the Manage Relationships dialog box, shown in Figure 2-10, click the relationship you want to work with and click Edit or Delete.If you click Edit, the Edit Relationship dialog box (shown in Figure 2-11) appears. The columns used to form the relationship are highlighted. Here, you can redefine the relationship by simply selecting the appropriate columns. You can also use the Active check box to disable or enable the relationship.
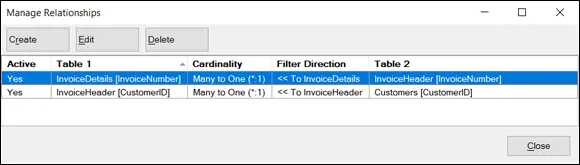
FIGURE 2-10:Use the Manage Relationships dialog box to edit or delete existing relationships.
In Figure 2-9, you see a graphic of an arrow between the list boxes. The graphic has an asterisk next to the list box on the left, and a number 1 next to the list box on the right. The number 1 basically indicates that the model will use the table listed on the right as the source for a unique primary key.
Every relationship must have a field that you designate as the primary key. Primary key fields are necessary in the data model to prevent aggregation errors and duplications. In that light, the Excel data model must impose some strict rules around the primary key.
You cannot have any duplicates or null values in a field being used as the primary key. So the Customers table (refer to Figure 2-9) must have all unique values in the CustomerID field, with no blanks or null values. This is the only way that Excel can ensure data integrity when joining multiple tables.
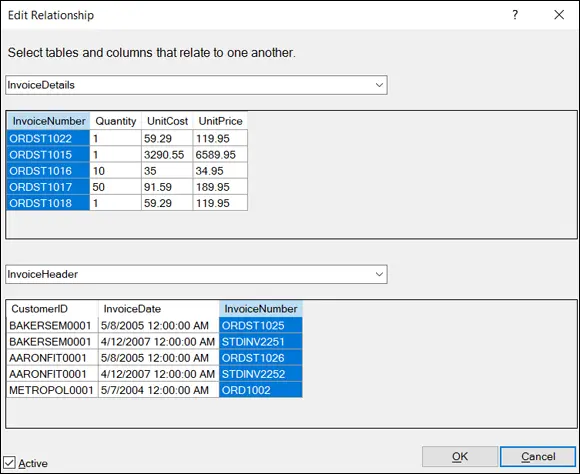
FIGURE 2-11:Use the Edit Relationship dialog box to adjust the tables and field names that define the selected relationship.
At least one of your tables must contain a field that serves as a primary key — that is, a field that contains only unique values and no blanks.
Using the Power Pivot data model in reporting
After you define the relationships in your Power Pivot data model, it’s essentially ready for action. In terms of Power Pivot, action means analysis with a pivot table. In fact, all Power Pivot data is presented through the framework of pivot tables.
Читать дальшеИнтервал:
Закладка:
Похожие книги на «Excel Power Pivot & Power Query For Dummies»
Представляем Вашему вниманию похожие книги на «Excel Power Pivot & Power Query For Dummies» списком для выбора. Мы отобрали схожую по названию и смыслу литературу в надежде предоставить читателям больше вариантов отыскать новые, интересные, ещё непрочитанные произведения.


Обсуждение, отзывы о книге «Excel Power Pivot & Power Query For Dummies» и просто собственные мнения читателей. Оставьте ваши комментарии, напишите, что Вы думаете о произведении, его смысле или главных героях. Укажите что конкретно понравилось, а что нет, и почему Вы так считаете.