Peter R. Shewry - Wheat
Здесь есть возможность читать онлайн «Peter R. Shewry - Wheat» — ознакомительный отрывок электронной книги совершенно бесплатно, а после прочтения отрывка купить полную версию. В некоторых случаях можно слушать аудио, скачать через торрент в формате fb2 и присутствует краткое содержание. Жанр: unrecognised, на английском языке. Описание произведения, (предисловие) а так же отзывы посетителей доступны на портале библиотеки ЛибКат.
- Название:Wheat
- Автор:
- Жанр:
- Год:неизвестен
- ISBN:нет данных
- Рейтинг книги:4 / 5. Голосов: 1
-
Избранное:Добавить в избранное
- Отзывы:
-
Ваша оценка:
Wheat: краткое содержание, описание и аннотация
Предлагаем к чтению аннотацию, описание, краткое содержание или предисловие (зависит от того, что написал сам автор книги «Wheat»). Если вы не нашли необходимую информацию о книге — напишите в комментариях, мы постараемся отыскать её.
is an essential resource for researchers and academics in disciplines including agriculture, plant biology, applied biology, botany, food science and nutrition, crop improvement, food security, environmental sustainability, and human health.
Wheat — читать онлайн ознакомительный отрывок
Ниже представлен текст книги, разбитый по страницам. Система сохранения места последней прочитанной страницы, позволяет с удобством читать онлайн бесплатно книгу «Wheat», без необходимости каждый раз заново искать на чём Вы остановились. Поставьте закладку, и сможете в любой момент перейти на страницу, на которой закончили чтение.
Интервал:
Закладка:
1.5 Grain Quality
1.5.1 Grain Size, Shape, and Specific Weight
Plump grain is preferred for milling because it gives higher flour yields than thin grain. The reason for this is simple; plump grain has a higher proportion of starchy endosperm to bran. Conversely, well filled, heavier grain tends to yield less bran ( Figure 1.21). The proportion of endosperm to bran is relevant to animal feed and alcohol production as well as to milling, because high starch contents are related to energy contents and alcohol yields, respectively.
Some of the scatter in Figure 1.21may be due to cultivar differences in grain shape rather than purely grain size. More rounded grain with a less pronounced crease should give higher flour extraction rates (Evers et al. 1990). Genetic analyses and molecular studies of grain size and shape have been reported (Gegas et al. 2010; Brinton and Uauy 2019). These should allow selection for grain size and shape in breeding programmes but direct selection for these qualities, as opposed to yield, is not usually carried out.
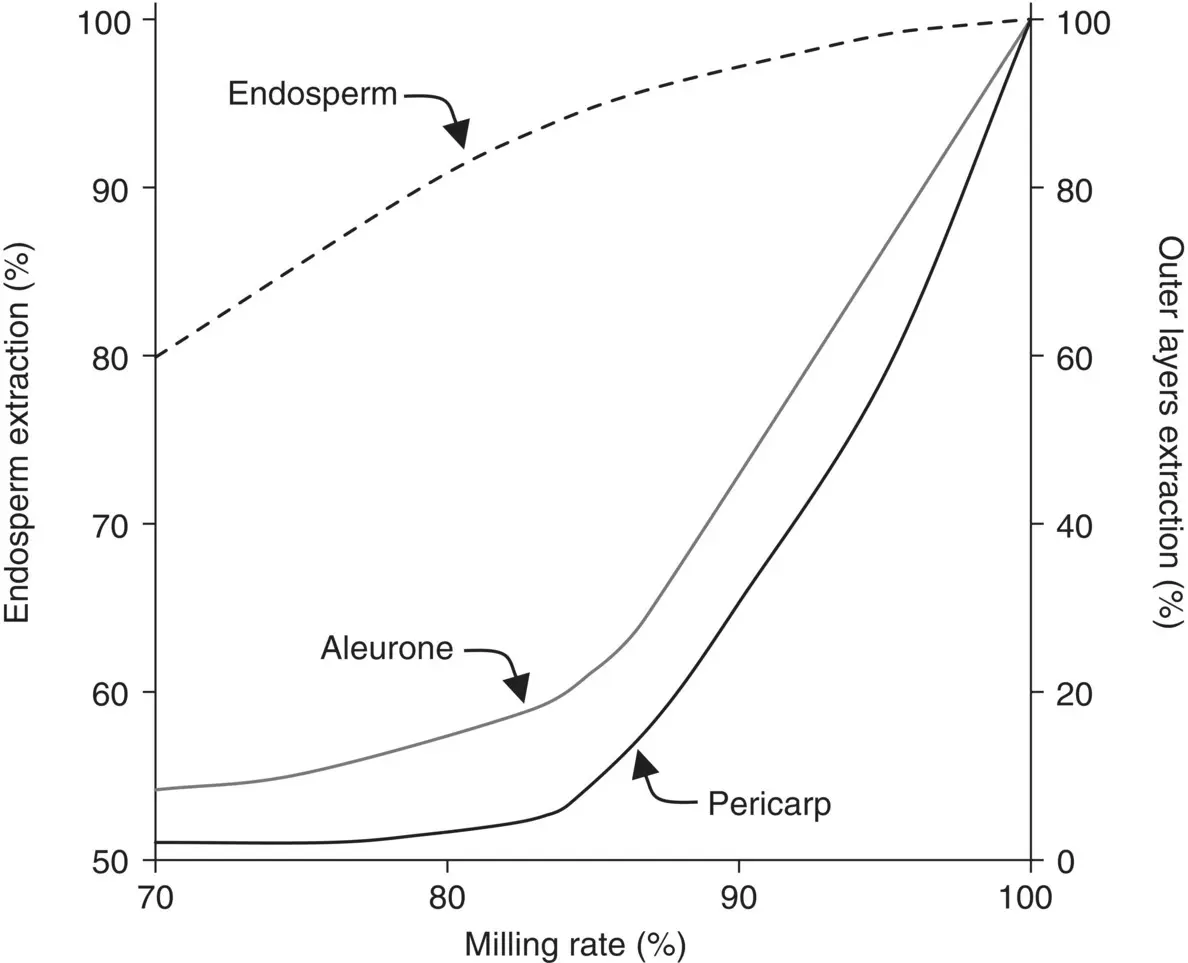
Figure 1.20 Determination, using phenolic acids as biochemical markers, of the grain tissues proportions (aleurone, pericarp, endosperm), as a function of total flour extraction rate (durum wheat grains, cv. Ardente).
Source: Redrawn from Hemery et al. (2007) with permission.
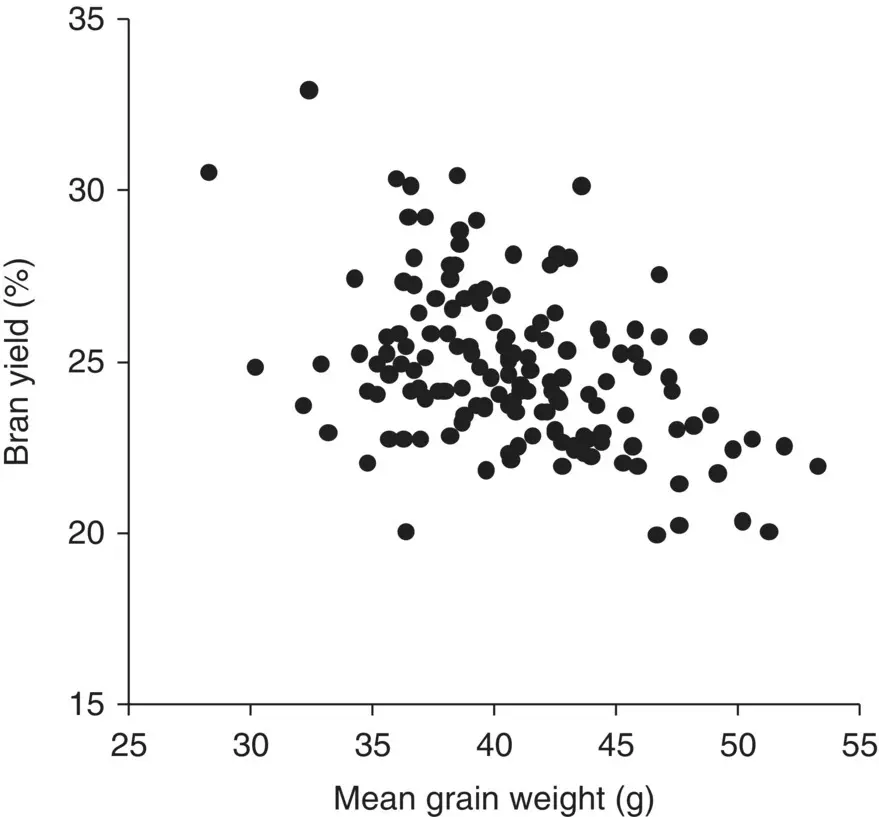
Figure 1.21 Relationship between grain weight and bran yield for 150 wheat genotypes from a single field experiment. Bran yields are determined using a small‐scale laboratory mill and are therefore higher than those achieved by large‐scale commercial mills.
Source: Redrawn from Ward et al. (2008) with permission.
What has long been selected for, however, is grain‐specific weight, also known as the hectolitre (hl)‐, test‐, or the bushel weight (e.g. Reeves and Roy 1974). Specific weight is the bulk packing density of grain; it was originally used over 150 years ago in wheat buying and selling to estimate the weight of wheat in a grain bin. It is one of the most widely used measures of grain quality for two main reasons. Firstly, it is easy and rapid to measure. Assessment requires the weighing of a known volume filled with grain in a controlled manner. Secondly, it is loosely related to grain size, shape, and shrivelling (e.g. Clarke et al. 2004). Grain samples with large numbers of shrivelled grain may have specific weights as low as 40 kg/hl. In the UK, the highest prices for breadmaking quality wheat commonly require specific weights of at least 76 kg/hl, while for animal feed a lower threshold is tolerated (often around 72 kg/hl). Unfortunately, the relationships between specific weight and flour extraction rates are not close (e.g. Hook 1984), particularly for specific weights above 70 kg/hl (e.g. Evers et al. 1990). This is perhaps unsurprising as significant reduction in endosperm contents only occurs in markedly shrivelled grain (Evers et al. 1990). As well as grain size and shape, specific weight is affected by the density of individual grains, preharvest weathering, moisture content, wetting, drying, grain handling, and other factors influencing surface properties. In addition to the genetic component, specific weight is highly dependent on environmental conditions and crop management during grain filling ( Chapters 3, 4, and 6).
1.5.2 Endosperm Texture
The classification of wheat into hard and soft types ( Chapter 8) is determined largely by the degree of cohesion between the protein and starch granules within the starchy endosperm, with hard wheats requiring greater force to break the grain and reduce the starchy endosperm to flour. Hardness is strongly but not entirely genetically determined, particularly by variation at the Hardness ( Ha ) locus on the short arm of chromosome 5D (Turnbull and Rahman 2002). When milled, hard wheats yield coarser but more evenly shaped flour particles. The flour is also more easily separated from the bran, and the particles flow easily over surfaces and through sieves (Kent and Evers 1994; Carson and Edwards 2009).
Endosperm texture can be determined by standardized grinding and sieving to weigh the proportion of material that will pass through a mesh. This is the basis of the Particle Size Index (PSI) determination with soft wheats having a greater proportion of throughs (and therefore greater PSI) than hard wheats (Carson and Edwards 2009). Near‐infrared reflectance (NIR) calibrated to PSI is routinely used for rapid determination of grain hardness at mill intake. Automated determination of hardness can also be made on a single grain basis using the Perten Single Kernel Characterization System (SKCS) (Pearson et al. 2007). This measures the weight, moisture content, and crush profiles of individual seeds. The standard sample size is 300 kernels and the software provides data on the distributions of the parameters.
1.5.3 Water Absorption
Determining the amount of water absorbed by flour is a crucial test used by bakers to optimise the mixing conditions for baking. Bakers therefore specify the level of water absorption (WA) for the flours they purchase, and millers adjust their milling conditions to achieve this level.
Although WA is affected by starch, protein, and fibre (see Chapter 8), the major concern of millers is the contribution of starch damage. This is because starch is the major component in the grain and damaged starch absorbs 3–4 times its own weight of water, compared with 0.5 times for undamaged starch. Starch damage is easier to achieve when milling hard wheats because they respond to higher grinding pressures during roller milling (Ford 1987). It is difficult to obtain high starch damage in soft wheats without excessive pressures leading to overheating and bran contamination (Ford 1987). Damaged starch leads to greater WA in dough formation, and more rapid fermentation rates. Both processes are desirable for modern breadmaking processes (Carson and Edwards 2009). The large amounts of water absorbed by hard flours also contribute to the longer shelf life of bread (shelf life being determined by drying and starch retrogradation). Hence, hard wheats are preferred for breadmaking ( Figure 1.21). By contrast, flours from soft wheats absorb little water and are preferred for the manufacture of most types of biscuit (cookies) where the low water content reduces the required baking time, cost, and the risk of cracking during cooling after baking. Soft wheats with low WA are also favoured for making cakes and pastries ( Figure 1.21).
WA is usually determined using the Brabender Farinograph. This automated mixer measures the resistance of flour and water while they are being mixed to form a dough. The level of maximum resistance can be adjusted to a predetermined optimum by altering the amount of water added, the ideal amount of water being a measure of WA (Kent and Evers 1994).
1.5.4 Gluten
In Section 1.4.1we introduced the unique properties of wheat doughs, pointing out that they have been significant factors behind the spread and adoption of wheat. Those unique properties are, in large part, due to the gluten proteins of wheat flour. There is a conundrum that the very component of wheat flour that contributes to its pre‐eminence as a foodstuff is also the proposed source of several adverse reactions to wheat consumption (Sapone et al. 2012). We therefore provide a brief introduction here to the gluten fraction and its role in processing and health. These properties, impacts, and potential mitigations are discussed in greater detail in Chapters 7– 10.
Читать дальшеИнтервал:
Закладка:
Похожие книги на «Wheat»
Представляем Вашему вниманию похожие книги на «Wheat» списком для выбора. Мы отобрали схожую по названию и смыслу литературу в надежде предоставить читателям больше вариантов отыскать новые, интересные, ещё непрочитанные произведения.


Обсуждение, отзывы о книге «Wheat» и просто собственные мнения читателей. Оставьте ваши комментарии, напишите, что Вы думаете о произведении, его смысле или главных героях. Укажите что конкретно понравилось, а что нет, и почему Вы так считаете.