Phosphors for Radiation Detectors
Здесь есть возможность читать онлайн «Phosphors for Radiation Detectors» — ознакомительный отрывок электронной книги совершенно бесплатно, а после прочтения отрывка купить полную версию. В некоторых случаях можно слушать аудио, скачать через торрент в формате fb2 и присутствует краткое содержание. Жанр: unrecognised, на английском языке. Описание произведения, (предисловие) а так же отзывы посетителей доступны на портале библиотеки ЛибКат.
- Название:Phosphors for Radiation Detectors
- Автор:
- Жанр:
- Год:неизвестен
- ISBN:нет данных
- Рейтинг книги:3 / 5. Голосов: 1
-
Избранное:Добавить в избранное
- Отзывы:
-
Ваша оценка:
Phosphors for Radiation Detectors: краткое содержание, описание и аннотация
Предлагаем к чтению аннотацию, описание, краткое содержание или предисловие (зависит от того, что написал сам автор книги «Phosphors for Radiation Detectors»). Если вы не нашли необходимую информацию о книге — напишите в комментариях, мы постараемся отыскать её.
Phosphors for Radiation Detectors
Discover a comprehensive overview of luminescence phosphors for radiation detection Phosphors for Radiation Detection,
Phosphors for Radiation Detection
Phosphors for Radiation Detection
Phosphors for Radiation Detectors — читать онлайн ознакомительный отрывок
Ниже представлен текст книги, разбитый по страницам. Система сохранения места последней прочитанной страницы, позволяет с удобством читать онлайн бесплатно книгу «Phosphors for Radiation Detectors», без необходимости каждый раз заново искать на чём Вы остановились. Поставьте закладку, и сможете в любой момент перейти на страницу, на которой закончили чтение.
Интервал:
Закладка:
(1.71) 
where A i, t , are τ iare intensity of each decay component, time, and decay time (lifetime) of each component, respectively. Sometimes, we deconvolute the excitation pulse (instrumental response function, IRF), and it should be noted that perfect deconvolution is generally difficult. After obtaining PL quantum yield Q and decay time τ , we can use convenient equations such as
(1.72) 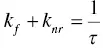
(1.73) 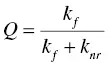
(1.74) 
where k fand k nrdenote rate constants of radiative and non‐radiative transitions, respectively. In this way, we can evaluate radiative and non‐radiative rate constants quantitatively.

Figure 1.12 Schematic drawing of PL decay setup.
PL is a phenomenon at localized luminescence centers, and except for some cases like the semiconductor scintillator, we do not consider the movement and interactions of carriers. In other words, PL is a phenomenon within a band‐gap. But scintillation is accompanied with interactions of carriers, and sometimes PL and scintillation offer very different emission spectra. As a basic scintillation property, we generally measure radioluminescence spectrum to obtain the scintillation emission intensity to select adequate photodetector for applications. A typical setup is illustrated in Figure 1.13. The most common setup uses an X‐ray generator as an excitation source, and if readers have another radiation source, they can use that instead of the X‐ray generator. We sometimes use α‐rays instead of X‐rays [89] in laboratory‐level experiments, and sometimes use other radiation sources at large facilities [90] by taking our experimental setup there. Scintillation photons are generally collected via an optical fiber, since a direct hit of ionizing radiation causes radiation damage to grating and photodetector, and to avoid this, we generally set them apart from the radiation source. In some literature, light yield is calculated by an integrated area of radioluminescence emission spectrum. It must be noted that such an evaluation is not correct in most cases, as explained in Section 1.3.3. Figure 1.14shows a geometry of transmission‐type measurement, and in some experiments, we use a reflection type measurement similar to the PL configuration.
Figure 1.13 Common setup of X‐ray induced radioluminescence spectrum measurement.
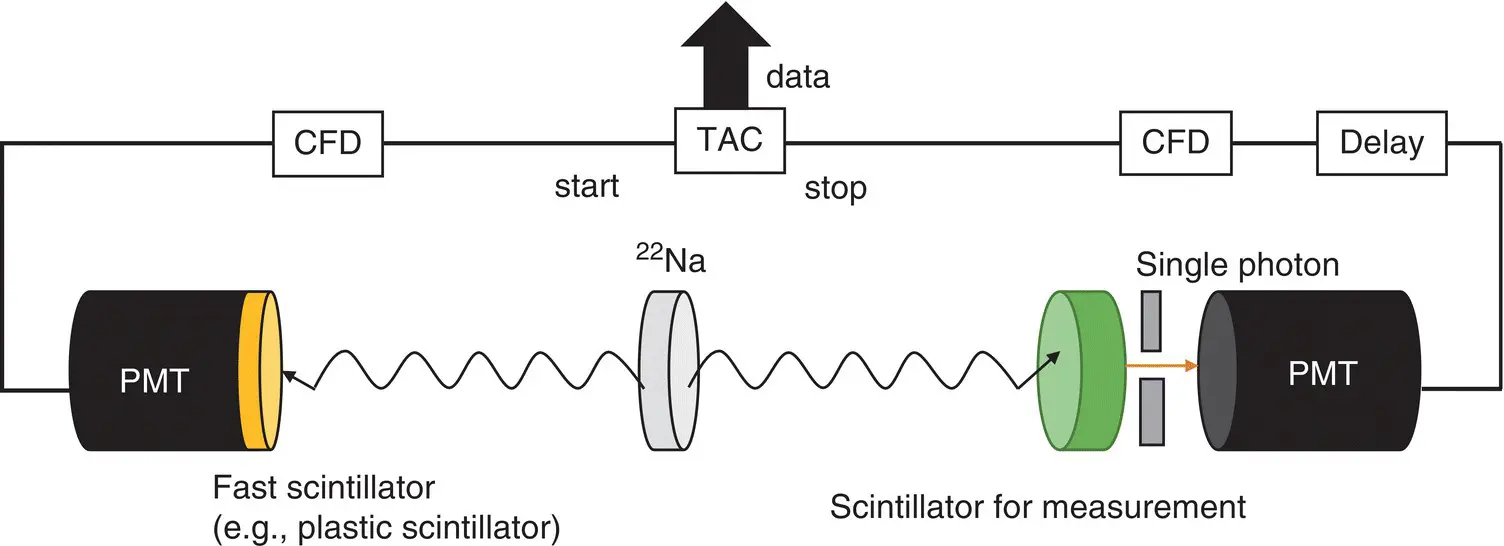
Figure 1.14 Common setup of γ‐ray induced scintillation decay curve measurement (delayed coincidence method).
Scintillation decay time is generally measured by γ‐ray or X‐ray excitation. Figure 1.14presents a typical setup for a γ‐ray induced scintillation decay curve measurement. The basic concept is the same as that in PL decay curve measurements but the excitation source is different. Generally, we use the 22Na radioisotope as an excitation source, which emits two 511 keV γ‐rays in 180° opposite directions. One of these two γ‐rays hits a fast scintillator, and creates a start signal through a constant fraction discriminator (CFD). At the opposite side, the other γ‐ray hits the target scintillator for measurement, and emits scintillation photons. Then, the number of these emitted scintillation photons are reduced to a single photon, and a signal pulse corresponding to the single photon is output from photodetector (typically, PMT). After some delay, the signal is injected into TAC as a stop signal through adequate delay and CFD. The process after TAC is the same with PL decay, and the analysis method is also the same. This typical experimental methodology is called delayed coincidence method (DCM). The difference with PL is that DCM generally does not resolve wavelength because of the low signal intensity and frequency. If we resolve the wavelength, a very long measurement time will be required.
Although DCM with a 511 keV γ‐ray source is the most common way to evaluate scintillation decay time, it contains several technical disadvantages. Because the energy of γ‐ray (511 keV) is high and has a high penetrative power of materials, detection efficiency is not high and requires a long time for the measurement to be made. In addition, low detection efficiency makes it difficult to measure a slow component, and generally, a component slower than several μs is difficult to measure. For example, measurements of emissions from Eu 3+, Tb 3+and most transition metal ions, are almost impossible, although they are used for integration‐type detectors. The lack of the wavelength resolution is also a problem because identification of the scintillation emission origin is sometimes difficult. In most cases, we can guess the emission origin by PL decay, but decays of scintillation and PL sometimes show a large discrepancy.
In order to solve these problems, some groups have developed pulse X‐ray‐based instruments for scintillation decay measurement. Pioneering work was done by the Lawrence Berkeley Laboratory (USA) with the cooperation of Hamamatsu Photonics (Japan) [91]. The key technology is a stable pulse X‐ray source which can be used at laboratory level, and if such a source is developed, we can use the same data processing system with PL decay and DCM. In this pulse X‐ray tube, the origin of the excitation is a laser diode or LED, and emits visible photons with 10–10 6Hz frequency, depending on the time range of measurement. Emitted visible photons hit a multi‐alkali photocathode of the X‐ray tube, and are converted into electrons. These electrons are accelerated by high voltage bias, and are lead to a tungsten target by a strong electric field. Then, bremsstrahlung X‐rays are generated and irradiated to the sample through a Be window. In this way, we can make a pulse X‐ray by the timing of laser diode or LED and use it as a start signal.
We now introduce some applications of this pulsed X‐ray tube for scintillation decay measurement. The timing resolution of an X‐ray tube is several tens ps, which is determined by the traveling time of accelerated electrons, and it is enough to measure the rise time of most scintillators [92]. Following these pioneering works, a pulse X‐ray equipped streak camera system was developed, and enabled us to observe the wavelength resolved scintillation decay curve [93]. In this system, the detection part consists of a spectrometer chamber, streak camera, and two‐dimensional CCD, and a two‐dimensional image of wavelength vs. time can be observed. By the streak system, one of the problems of DCM, non‐wavelength resolution, can be solved. Up until the development of the streak camera system, every study used a pulse laser diode as the root of the excitation source, and it was enough to measure fast‐timing events. However, it is not sufficient to measure slow events, especially in the ms time range. One of the solutions for ms measurement is to replace the excitation source to common LED, which has higher power than the pulse‐type laser diode but slower speed. The pulse LED type system was developed in 2014 [94]. This system enabled us to measure slow (ms) scintillation decay as well as the X‐ray induced afterglow. Because the signal intensity per unit time is very low in slower scintillation, the system does not offer the function of wavelength resolution, and the detection part is one PMT. When we compare with typical measurements by DCM, the measurement time dramatically decreases to a few minutes for one sample. At present, no significant difference of excitation energy between 511 keV (DCM) and several tens keV (pulse X‐ray tube) has been found.
Читать дальшеИнтервал:
Закладка:
Похожие книги на «Phosphors for Radiation Detectors»
Представляем Вашему вниманию похожие книги на «Phosphors for Radiation Detectors» списком для выбора. Мы отобрали схожую по названию и смыслу литературу в надежде предоставить читателям больше вариантов отыскать новые, интересные, ещё непрочитанные произведения.


Обсуждение, отзывы о книге «Phosphors for Radiation Detectors» и просто собственные мнения читателей. Оставьте ваши комментарии, напишите, что Вы думаете о произведении, его смысле или главных героях. Укажите что конкретно понравилось, а что нет, и почему Вы так считаете.