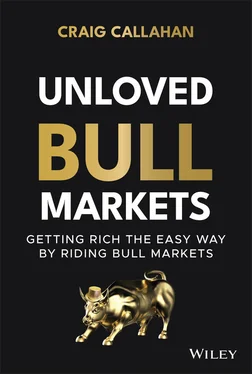
Craig Callahan - Unloved Bull Markets
Здесь есть возможность читать онлайн «Craig Callahan - Unloved Bull Markets» — ознакомительный отрывок электронной книги совершенно бесплатно, а после прочтения отрывка купить полную версию. В некоторых случаях можно слушать аудио, скачать через торрент в формате fb2 и присутствует краткое содержание. Жанр: unrecognised, на английском языке. Описание произведения, (предисловие) а так же отзывы посетителей доступны на портале библиотеки ЛибКат.
- Название:Unloved Bull Markets
- Автор:
- Жанр:
- Год:неизвестен
- ISBN:нет данных
- Рейтинг книги:3 / 5. Голосов: 1
-
Избранное:Добавить в избранное
- Отзывы:
-
Ваша оценка:
- 60
- 1
- 2
- 3
- 4
- 5
Unloved Bull Markets: краткое содержание, описание и аннотация
Предлагаем к чтению аннотацию, описание, краткое содержание или предисловие (зависит от того, что написал сам автор книги «Unloved Bull Markets»). Если вы не нашли необходимую информацию о книге — напишите в комментариях, мы постараемся отыскать её.
Unloved Bull Markets: Getting Rich the Easy Way by Riding Bull Markets
Unloved Bull Markets
Unloved Bull Markets
Unloved Bull Markets — читать онлайн ознакомительный отрывок
Ниже представлен текст книги, разбитый по страницам. Система сохранения места последней прочитанной страницы, позволяет с удобством читать онлайн бесплатно книгу «Unloved Bull Markets», без необходимости каждый раз заново искать на чём Вы остановились. Поставьте закладку, и сможете в любой момент перейти на страницу, на которой закончили чтение.
Интервал:
Закладка:
Table of Contents
1 Cover
2 Title Page Unloved Bull Markets Getting Rich the Easy Way by Riding Bull Markets Craig Callahan
3 Copyright
4 Preface
5 Acknowledgments
6 About the Author
7 Introduction
8 Chapter 1: “Unloved” Bull Markets Investor Sentiment Public Funds Pension Plans and Endowments Anecdotal Examples of Unloved Confidence Yields Suggest “Unloved” Other Assets Does Rate of Return Matter? Top Ten Reasons I Missed the Bull Market Unloved? Why?
9 Chapter 2: Was the Bull Market Sensible? Annual Returns Sectors and Volatility Earnings Value Down Days Similar Crashes, Similar Recoveries Summary
10 Chapter 3: News and Stock Prices Industry-Specific News Expectations
11 Chapter 4: Economic Setting Europe China Economic Surprises Summary
12 Chapter 5: Inflation and Interest Rates Stuck in the 1970s Phony, Fabricated, and Dangerous Negative Interest Rates Why Didn't the Easy Monetary Policy Ignite Inflation? Capacity Utilization 2009 Outlook Velocity of Money Are Low Interest Rates Rational and Normal? Summary
13 Chapter 6: The Federal Reserve and Monetary Policy Money Supply Europe and China Peak Conditions Neutral Monetary Policy M1 Not Rates Summary
14 Chapter 7: Unemployment Spending Leads Employment Phillips Curve Summary
15 Chapter 8: Betting on a Lackluster Stock Market and Higher Interest Rates
16 Chapter 9: Volatility Events 1990 and 1998 CNBC TV Value Setbacks and Theme Reversals Accepting the Stock Market as It Is Summary
17 Chapter 10: Six Pieces of Bad Information Overpriced? Deflation Corporate Buybacks Lackluster Revenue Growth and Earnings Corporate Debt Inverted Yield Curve Summary
18 Chapter 11: Active-Passive Market Capitalization Value–Growth Pace Changing Market Conditions Behavioral Finance Passive Investing's Dark Side Summary
19 Chapter 12: Strategies Ten Investment Strategies Classifying by Strategy Performance Factors Strategies Contributed to “Unloved”? Summary
20 Chapter 13: Human Behavior Short Sellers Human Behavior–Economic Forecasting Want to Relive It? Final Quiz
21 Chapter 14: And Then It Ended with a Crash Stock Market Crash Abnormal Peak Stunning Visual
22 Chapter 15: I Want My Money Back Unloved Rebound Money Market Fund Assets Sectors Strategies Monetary Policy Pace Down Days Economic Surprise Unemployment Value and Sentiment Top Ten Reasons Summary
23 Chapter 16: Conclusion Perceived Uncertainty Gains versus Losses Type 1, Type 2 Half Empty–Partly Cloudy When Will It End?
24 Index
25 End User License Agreement
List of Tables
1 Chapter 1 Table 1.1 Average Annual Net Flows (in $ Millions) Table 1.2 Average Weekly Bull/Bear Ratio (in %) Table 1.3 Rates of Return for the S&P 500 (%)
2 Chapter 2 Table 2.1 Rates of Return from the Market Low, 3/9/2009–2/19/2020 Table 2.2 Sector Ranked During Market Declines in 2010, 2011, and 2018 Table 2.3 Bull Markets
3 Chapter 3Table 3.1 Yields (%)
4 Chapter 5Table 5.1 Bond Valuation BasicsTable 5.2 Consumer Price Index (CPI) before and after a Recession
5 Chapter 6Table 6.1 GDP & CPI Around Market PeaksTable 6.2 Current Conditions: April 1, 2015Table 6.3 Previous Three Peaks
6 Chapter 7Table 7.1 S&P 500 Index Returns Off Recession LowsTable 7.2 S&P 500 Earnings Per Share (EPS)Table 7.3 S&P 500 Returns Off Two Market Bottoms
7 Chapter 9Table 9.1 Market V/PTable 9.2 Sector Returns in Up and Down Phases
8 Chapter 10Table 10.1 R-Squared for P/E and ReturnsTable 10.2 Rate-of-Return, Four P/E RatiosTable 10.3 Year-Over-Year CPI Change and Rate-of-ReturnTable 10.4 Operational and Financial LeverageTable 10.5 Yield Inversions: 10-Year Treasury and Federal Funds
9 Chapter 11Table 11.1 Pace of Bull Markets and Active Management (by Percent)
10 Chapter 12Table 12.1 Average Monthly Strategy Returns, Jan. 1980–Feb. 2009Table 12.2 Standard Deviation of Monthly Returns, Jan. 1980–Feb. 2009Table 12.3 Average Monthly Strategy Returns, March 2009–Feb. 2020Table 12.4 Valuation's Rank in Bull Markets
11 Chapter 15Table 15.1 Sector ReturnsTable 15.2 Strategies
12 Chapter 16Table 16.1 Types of Errors
List of Illustrations
1 Introduction Figure Intro.1 S&P 1500 Index, 12/31/2008–4/30/2010
2 Chapter 1 Figure 1.1 Equity Fund Net Flows and S&P 500 Index, 1984–2019 Figure 1.2 AAII Bull/Bear Ratio, Four-Week Average Figure 1.3 Public Funds, Equities as a Percent of Assets Figure 1.4 Barron's Confidence Index, 12/29/1978–2/21/2020 Figure 1.5 Yields: S&P 500 and 10-Year Treasury 1962–2020 Figure 1.6 Cumulative Return 2009–2019 Figure 1.7 Compounding at 10% and 5% Figure 1.8 S&P 1500 Index 1/30/09–2/19/20
3 Chapter 2 Figure 2.1 S&P 500 Annual Returns (1926–2020) Figure 2.2 S&P 1500 Earnings Per Share 2006–2023 Figure 2.3 S&P 1500 Index and Fair Value Figure 2.4 October Crashes of 1987 and 2008 Figure 2.5 S&P 500 Index, Crashes of 1987 and 2008 Nine Years Later
4 Chapter 3Figure 3.1 Hypothetical Stock Market and EconomyFigure 3.2 Stock Prices and Employment, 1967–1976Figure 3.3 Stock Prices and Employment, 1999–2019
5 Chapter 4Figure 4.1 Quarter-Over-Quarter GDP, 3/2008–12/2019 DGPFigure 4.2 Quarter-Over-Quarter GDP 3/08–12/19Figure 4.3 China Year-Over-Year GDP, 2008–2019Figure 4.4 Citi Economic Surprise Index
6 Chapter 5Figure 5.1 Twelve-Month Rolling CPI Rate of Change, 1/1970–6/2021Figure 5.2 Capacity UtilizationFigure 5.3 Velocity of M1 (Money Supply), 1929–2021Figure 5.4 Moody's AAA Bond Yield, 1929–2020
7 Chapter 6Figure 6.1 M1 Rolling Fifty-Two-Week Percentage ChangeFigure 6.2 M1 Rolling Fifty-Two-Week Percentage Change, 1/05–2/20Figure 6.3 Year-Over-Year Money Supply Growth, Europe and ChinaFigure 6.4 Bear Markets
8 Chapter 7Figure 7.1 Unemployment Rate, 1982 and 2008 RecessionFigure 7.2 Unemployment Rate, 1982 and 2008 RecessionsFigure 7.3 Personal Consumption and Unemployment, 12/31/07–12/31/12Figure 7.4 Hypothetical Phillips Curve
9 Chapter 9Figure 9.1 S&P 500 Index, 12/31/1989–12/31/1992Figure 9.2 1990 and 1998 Volatility EventsFigure 9.3 S&P 500 Index, 2010 and 2011 Volatility EventsFigure 9.4 S&P 500 Index, 2018 and 1990 Volatility EventsFigure 9.5 Cost of Reducing Volatility
10 Chapter 10Figure 10.1 S&P 500 Index and Forward ReturnsFigure 10.2 S&P 500 Debt/Total AssetsFigure 10.3 S&P 500 Debt/EquityFigure 10.4 Debt/EBITDA
11 Chapter 11Figure 11.1 Ratio of P/E of Small-Cap 600 to Large-Cap 500Figure 11.2 Ratio of P/E, S&P 500 Growth/ValueFigure 11.3 Active Equity Opportunity Index, 1/1998–7/2021
12 Chapter 13Figure 13.1 Short Interest/Float and S&P 1500 Index, 1/2009–2/2020Figure 13.2 Hypothetical Linear Regression, High CorrelationFigure 13.3 Hypothetical Regression, Lower CorrelationFigure 13.4 Slopes and Sensitivity
13 Chapter 14Figure 14.1 S&P 1500 Index 12/24/2018–3/23/2020
14 Chapter 15Figure 15.1 S&P 1500 IndexFigure 15.2 AAII Sentiment, Bulls/Bears 1/2/20–9/10/21Figure 15.3 Money Market Fund Assets 1/2/2019–9/9/2021Figure 15.4 EPS with 10% Growth and Stock Price with P/E = 2Figure 15.5 EPS and Price with a RecessionFigure 15.6 Fifty-Two-Week Rate of Change in M1, 12/28/18–2/12/21Figure 15.7 Economic Surprise and S&P 500 IndexFigure 15.8 Unemployment, 2008 and 2020 RecessionsFigure 15.9 Value and Investor Sentiment
15 Chapter 16Figure 16.1 S&P 1500 Index
Guide
1 Cover
2 Table of Contents
3 Title Page Unloved Bull Markets Getting Rich the Easy Way by Riding Bull Markets Craig Callahan
4 Copyright
5 Preface
6 Acknowledgments
7 About the Author
8 Introduction
9 Begin Reading
10 Index
Читать дальшеИнтервал:
Закладка:
Похожие книги на «Unloved Bull Markets»
Представляем Вашему вниманию похожие книги на «Unloved Bull Markets» списком для выбора. Мы отобрали схожую по названию и смыслу литературу в надежде предоставить читателям больше вариантов отыскать новые, интересные, ещё непрочитанные произведения.
Обсуждение, отзывы о книге «Unloved Bull Markets» и просто собственные мнения читателей. Оставьте ваши комментарии, напишите, что Вы думаете о произведении, его смысле или главных героях. Укажите что конкретно понравилось, а что нет, и почему Вы так считаете.


