Craig Callahan - Unloved Bull Markets
Здесь есть возможность читать онлайн «Craig Callahan - Unloved Bull Markets» — ознакомительный отрывок электронной книги совершенно бесплатно, а после прочтения отрывка купить полную версию. В некоторых случаях можно слушать аудио, скачать через торрент в формате fb2 и присутствует краткое содержание. Жанр: unrecognised, на английском языке. Описание произведения, (предисловие) а так же отзывы посетителей доступны на портале библиотеки ЛибКат.
- Название:Unloved Bull Markets
- Автор:
- Жанр:
- Год:неизвестен
- ISBN:нет данных
- Рейтинг книги:3 / 5. Голосов: 1
-
Избранное:Добавить в избранное
- Отзывы:
-
Ваша оценка:
- 60
- 1
- 2
- 3
- 4
- 5
Unloved Bull Markets: краткое содержание, описание и аннотация
Предлагаем к чтению аннотацию, описание, краткое содержание или предисловие (зависит от того, что написал сам автор книги «Unloved Bull Markets»). Если вы не нашли необходимую информацию о книге — напишите в комментариях, мы постараемся отыскать её.
Unloved Bull Markets: Getting Rich the Easy Way by Riding Bull Markets
Unloved Bull Markets
Unloved Bull Markets
Unloved Bull Markets — читать онлайн ознакомительный отрывок
Ниже представлен текст книги, разбитый по страницам. Система сохранения места последней прочитанной страницы, позволяет с удобством читать онлайн бесплатно книгу «Unloved Bull Markets», без необходимости каждый раз заново искать на чём Вы остановились. Поставьте закладку, и сможете в любой момент перейти на страницу, на которой закончили чтение.
Интервал:
Закладка:
In previous bull markets, if the market was higher one day, there would be more buying the next day by momentum investors. It is often referred to as “fear of missing the boat” as it is pulling away from the dock. In a bull market it is usually a terrible feeling seeing the market move higher while holding cash. During this bull market, however, if the market was higher on a day the next day saw a sell-off thirty to sixty minutes into the trading day. It felt like investors, not realizing we were in a bull market, felt the advance the day before gave them a chance to get out. So to move higher two days in a row, buyers had to take out the weak jittery money.
One metric used by investors who use technical analysis is comparing the number of issues that advance each day to the number that decline. If over a recent period of, say, ten or thirty days a lot more issues are advancing than declining, there are two interpretations. One is that the advance has breadth and is sustainable. The other is that the market is “overbought” and will soon turn and go lower. Commentary during the bull market typically favored the negative view as the market was labeled “overbought.” It appears that the analyst's predetermined bearish bias influenced the interpretation of the data.
For the eleven-year bull market and especially for the new one that began March 2020, there is a new generation of investor. These new investors are very situational. They don't believe in the broad market, just special situations like the unique stories of Amazon or Tesla. In the early stages of the 2020 bull market, it was the “work from home” theme. How would investors behave if they didn't believe in the bull market but just invested or speculated in a stock they think is unique? They tend to be jittery and set very quick sell thresholds that we believe explains some of the volatility and rapid theme changes that occurred during the eleven-year bull market and the new 2020 bull market.
Confidence
Every week Barron's computes and publishes its Confidence Index. The editors define it as the ratio of the yield on high-grade bonds divided by the yield on intermediate-grade bonds. Think of it as measuring the confidence investors have in the financial system. Naturally investors need a higher yield on the riskier intermediate-grade bonds than they do on the higher rated bonds. If the two yields are very close, say high-grade is 95% of intermediate-grade, investors have confidence in the system and the ability of intermediate-grade companies to honor their payments. But if there is a wide yield gap, say the yield on higher-grade bonds is only 60% of the much higher yield on intermediate-grade bonds, investors would be showing little confidence in the financial system and intermediate-grade companies’ abilities to honor their payments.
Figure 1.4shows the Confidence Index from December 29, 1978, through February 21, 2020. The straight line represents the average reading for three different time periods. It averaged 93.2 from December 29, 1978, through December 31, 1999. Then it dropped and averaged 83.5 from January 7, 2000, through December 31, 2008. From January 2, 2009, through February 21, 2020, covering the eleven-year bull market and a couple of months before it began, it averaged only 73.5. This recent bull market took place in a setting of low investor confidence in the financial system.
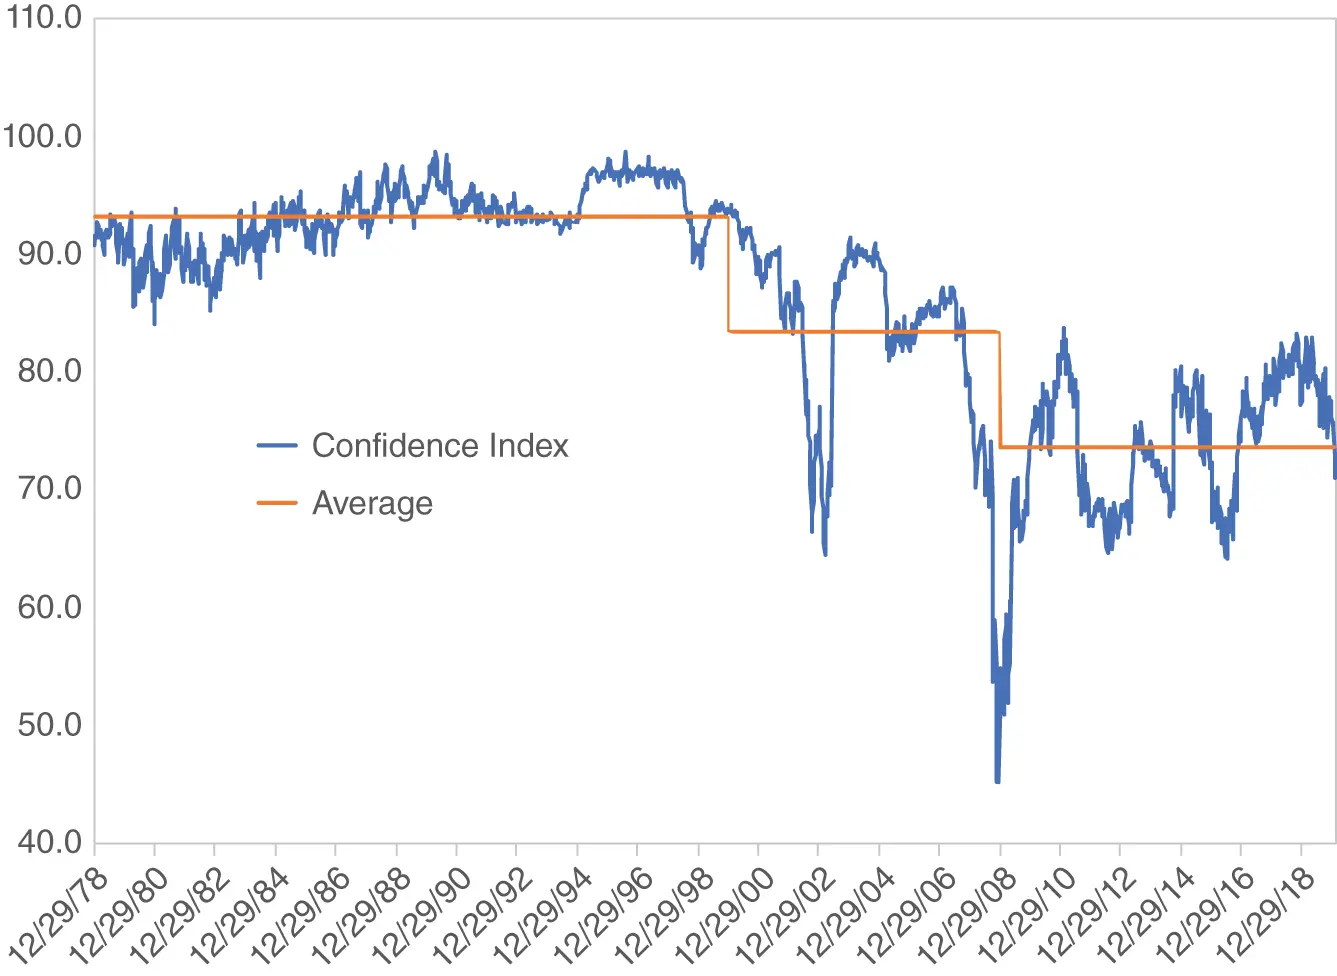
Figure 1.4 Barron's Confidence Index, 12/29/1978–2/21/2020
We contend an investor's confidence affects how he or she receives and processes news. If confidence is high, bad news might get dismissed or softened in its perception. If confidence is low, bad news is on the fast track to negative sensors. During this bull market, investors were viewing the glass as half empty. In this state, they were overly sensitive to mediocre and bad news, with good news or bullish indicators flying under their radar. It is almost as if they were screaming, “Don't tell me facts, I'm too scared to listen.”
Yields Suggest “Unloved”
Interest payments on 10-year Treasury notes are fixed over the life of the note. Dividends for companies in the S&P 500 Index have grown through the years. As seen in Figure 1.5of year-end yields for the 10-year Treasury and the S&P 500 Index, the yield is usually higher for the 10-year Treasury. Investors are willing to accept a lower current yield on stocks because they expect the dividends to grow. Since 1962, the yield on the 10-year Treasury has exceeded the yield on the S&P 500, on average, by about 300 basis points.

Figure 1.5 Yields: S&P 500 and 10-Year Treasury 1962–2020
There have been six times when the yield on the S&P 500 Index has been greater than the yield on the 10-year Treasury: year-ends 1962, 2008, 2011, 2012, 2019, and 2020. Once the two were about equal: year-end 2015. What was going on these seven times to reverse a normal, rational yield relationship? News events at the time of a few of these could explain investor behavior. The Cuban Missile Crisis was October 1962. The financial crisis was October 2008. The European debt crisis round two was September 2011. Investors were obviously afraid of owning stocks and were clinging to the safety of Treasury notes. They sold stocks and bid up the price of the Treasury notes, which lowered their yield. Five times during this multiyear bull market, investors disliked stocks so much, we were offered a higher yield on the S&P 500 than on the 10-year Treasury, despite the potential for the S&P 500 to provide dividend growth and capital appreciation. We had not seen this desperate yield relationship for forty-six years, then it appeared five times just before and during this multiyear bull market.
When the yield on the S&P 500 is equal to or exceeding the yield on the 10-year Treasury it signals that stocks are cheap and bonds are expensive. It is telling us investors like bonds and dislike equities and has been a very good “buy” signal for equities. Table 1.3shows the rates of return for the S&P 500 for one and two years after the seven times of unusual relative yields.
Table 1.3 Rates of Return for the S&P 500 (%)
| Year | One-Year | Two-Year |
|---|---|---|
| 1962 | 22.8 | 42.9 |
| 2008 | 26.5 | 45.5 |
| 2011 | 16.0 | 53.6 |
| 2012 | 34.6 | 53.0 |
| 2015 | 12.0 | 36.4 |
| 2019 | 18.3 | ??? |
| 2020 | ??? | ??? |
Other Assets
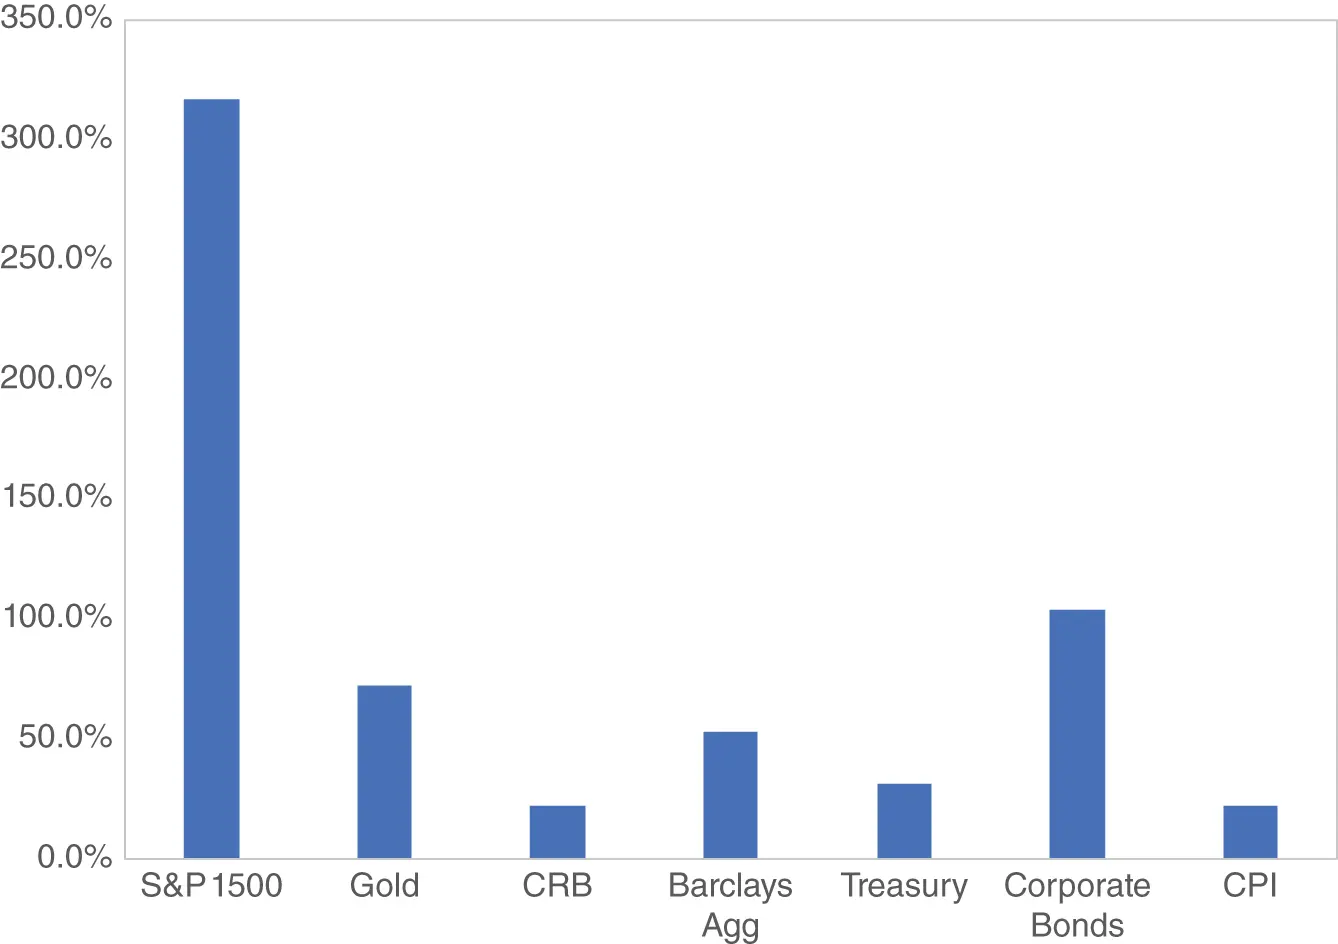
It might have been alright to miss out on the bull market in domestic equities if similar returns could have been earned in other types of assets, but that is not the case. Domestic equities were clearly the sweet spot of investing during the multiyear bull market. Figure 1.6shows cumulative returns for 2009 through 2019 for the S&P 1500 Index, Gold, the Commodities Research Board (CRB) Index, three bond indexes, and the Consumer Price Index. Although the nonstock assets beat inflation, they trailed equities severely. The stock market was the place to be and missing out on the bull market was a big deal.
Интервал:
Закладка:
Похожие книги на «Unloved Bull Markets»
Представляем Вашему вниманию похожие книги на «Unloved Bull Markets» списком для выбора. Мы отобрали схожую по названию и смыслу литературу в надежде предоставить читателям больше вариантов отыскать новые, интересные, ещё непрочитанные произведения.
Обсуждение, отзывы о книге «Unloved Bull Markets» и просто собственные мнения читателей. Оставьте ваши комментарии, напишите, что Вы думаете о произведении, его смысле или главных героях. Укажите что конкретно понравилось, а что нет, и почему Вы так считаете.
