Craig Callahan - Unloved Bull Markets
Здесь есть возможность читать онлайн «Craig Callahan - Unloved Bull Markets» — ознакомительный отрывок электронной книги совершенно бесплатно, а после прочтения отрывка купить полную версию. В некоторых случаях можно слушать аудио, скачать через торрент в формате fb2 и присутствует краткое содержание. Жанр: unrecognised, на английском языке. Описание произведения, (предисловие) а так же отзывы посетителей доступны на портале библиотеки ЛибКат.
- Название:Unloved Bull Markets
- Автор:
- Жанр:
- Год:неизвестен
- ISBN:нет данных
- Рейтинг книги:3 / 5. Голосов: 1
-
Избранное:Добавить в избранное
- Отзывы:
-
Ваша оценка:
- 60
- 1
- 2
- 3
- 4
- 5
Unloved Bull Markets: краткое содержание, описание и аннотация
Предлагаем к чтению аннотацию, описание, краткое содержание или предисловие (зависит от того, что написал сам автор книги «Unloved Bull Markets»). Если вы не нашли необходимую информацию о книге — напишите в комментариях, мы постараемся отыскать её.
Unloved Bull Markets: Getting Rich the Easy Way by Riding Bull Markets
Unloved Bull Markets
Unloved Bull Markets
Unloved Bull Markets — читать онлайн ознакомительный отрывок
Ниже представлен текст книги, разбитый по страницам. Система сохранения места последней прочитанной страницы, позволяет с удобством читать онлайн бесплатно книгу «Unloved Bull Markets», без необходимости каждый раз заново искать на чём Вы остановились. Поставьте закладку, и сможете в любой момент перейти на страницу, на которой закончили чтение.
Интервал:
Закладка:
The great bull market ended February 19, 2020, just two weeks short of its eleventh birthday. Then the market experienced a twenty-three-trading-day crash, from February 19 to March 23. We could argue that twenty-three days does not qualify as a bear market and that the dip was just an interruption to the multiyear bull market. Because the S&P 1500 Index dropped 34.5% over that period, we would probably lose that argument because a drop of 20% or more is a very popular, although arbitrary, definition of a bear market.
If we concede that the eleven-year bull market ended, then the rally off the March 23, 2020, low must be a new bull market and a spectacular one at that. The NASDAQ Index got back to a new all-time high in fifty-three trading days. The S&P 500 Index took 103 trading days. If the eleven-year bull market was “unloved,” its sequel was downright despised, as shown by the bearish, skeptical, negative commentary that dominated print and broadcast media.
As in 2009, I was interviewed just before and after the bottom and provided a bullish outlook. In an interview with nationally syndicated financial columnist Chuck Jaffe that aired on his podcast “Money Life” on March 20, 2020, one trading day before the bottom, I stated, “Best bargains we have ever seen.” Mr. Jaffe then asked, “When do you buy?” I responded, “There are all of the supportive conditions typical of buying opportunities. I think that it is a matter of days or weeks. We're close.” A week and a half later, on CNBC TV “The Exchange,” I declared, “We do believe a bottom is forming and it seems like all the bad news is priced in.”
The two recent bull markets that began March 2009 and March 2020 seemed obvious to us but not to most investors.
Chapter 1 “Unloved” Bull Markets
Along with many other observers, Tom Keene of Bloomberg Surveillance Radio called the multiyear bull market, from March 2009 to February 2020, “unloved.” We agree and believe that, for a variety of reasons, many investors chose not to participate in the market and missed out on a terrific opportunity to increase wealth. In previous bull markets, investors gained confidence and faith as the market advanced. Not this one. Unlike in previous bull markets, investors neither gained confidence nor faith in the workings of the market. If anything, the advance only encouraged the opposite: skepticism and doubt.
The Investment Company Institute (ICI) reports mutual fund data in its annual Investment Company Fact Book regarding annual inflows, outflows, and net flows for equity mutual funds beginning in 1984. Figure 1.1shows annual net flows, which is inflows (sales) minus outflows (redemptions) in millions of dollars in gray scaled on the right. The S&P 500 Index is in black with quarterly observations scaled on the left.
Although the bull market in the early 1980s began in August 1982, equity fund flow data begin in 1984. Nevertheless, we see increasing positive flows in 1984, 1985, 1986, and 1987 as the S&P 500 moved higher. The market advance attracted investors, as they apparently gained confidence. There were net outflows in 1988 as investors moved away from equities after the market crash of October 1987. As it happens investors were captivated by the crash in their rearview mirrors and couldn't bear to face the bull market ahead.
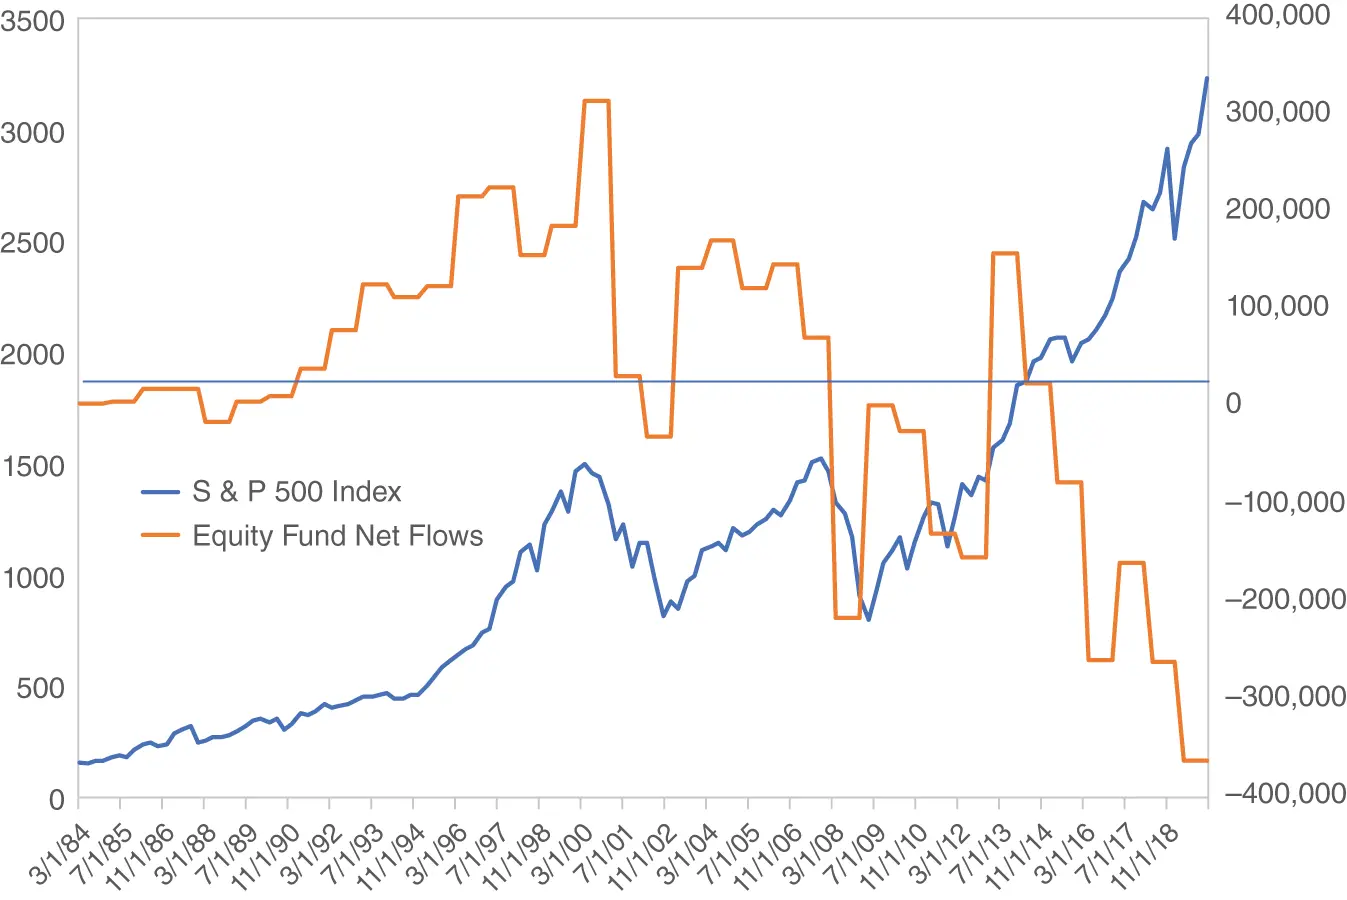
Figure 1.1 Equity Fund Net Flows and S&P 500 Index, 1984–2019
As the next bull market started, equity mutual fund net flows turned positive and grew accordingly with the market advance. The graph shows how the rising market enticed investors to buy equity mutual funds. In the end of that bull market, net flows hit their peak concurrent with the high of the S&P 500 Index. During the market decline following the “tech bubble” of early 2000, investors greatly reduced their investing into equity mutual funds. As the market advanced off the September 2002 low, investors sent net positive flows into equity mutual funds, not to the extent seen in the late 1990s but still enough to reflect confidence and optimism for equities.
Compared to the previous bull markets post 1987 and 2002, what makes this recent bull market “unloved”? The surge off the market low in early 2009 barely got net flows positive, but 2010, 2011, and 2012 saw a race for the exits even though the market moved higher. Unable to see the multiyear bull market ahead of them, the only emotions investors were capable of was simply, “Get me out of here!” Only one year, 2013, saw significant net positive flows, but after that brief period of confidence in equities, investors reverted to a negative view, especially in 2016, 2017, and 2018. These net redemptions were clearly early as the S&P 500 hit an all-time high February 2020 and those who redeemed along the way did not participate.
Outflows continued as the market moved higher in 2019, as reported in the Wall Street Journal December 9, 2019, in a front page article with the title “Individual Investors Bail on Stocks.” “The S&P 500 is having its best run in six years, but individual investors are fleeing stock funds at the fastest pace in decades.” It continued, “Investors have pulled $135.5 billion from U.S. stock-focused mutual funds and exchange traded funds so far this year, the biggest withdrawals on record, according to data provider Refinitiv Lipper, which tracked the data going back to 1992.”
Table 1.1shows the average annual net flows into equity mutual funds for four bull markets. It was positive for the previous three bull markets but negative for the most recent one. The market was moving higher but investors were fleeing equities, unusual, but explained by investor sentiment in the next section.
Table 1.1 Average Annual Net Flows (in $ Millions)
| 1984–1987 | 12,649 |
| 1988–1999 | 106,520 |
| 2003–2007 | 132,040 |
| 2009–2019 | −112,279 |
Investor Sentiment
The America Association of Individual Investors (AAII) conducts a weekly investment sentiment survey of its members. It asks, “Are you bullish, neutral, or bearish?,” meaning, does the respondent think the stock market is going higher, sideways, or lower? The survey began July 1987. Figure 1.2shows a rolling four-week average of the percent bullish divided by the percent bearish from July 1987 through February 2020. The middle line is the average for the entire time period, right near 1.50%, meaning typically three bulls for every two bears. The other two lines are one standard deviation above and below average. Before focusing on the recent bull market, some general observations are noteworthy. This group can really be wrong sometimes. The two arrows above highlight some extremes like the excessive bullishness precrash 1987 and at the tech bubble peak of early 2000. Those were terrible times to be bullish. The four arrows at the bottom represent great buying opportunities when the market went higher but investors were extremely (incorrectly) bearish: 1990, 1998, 2003, and 2009.
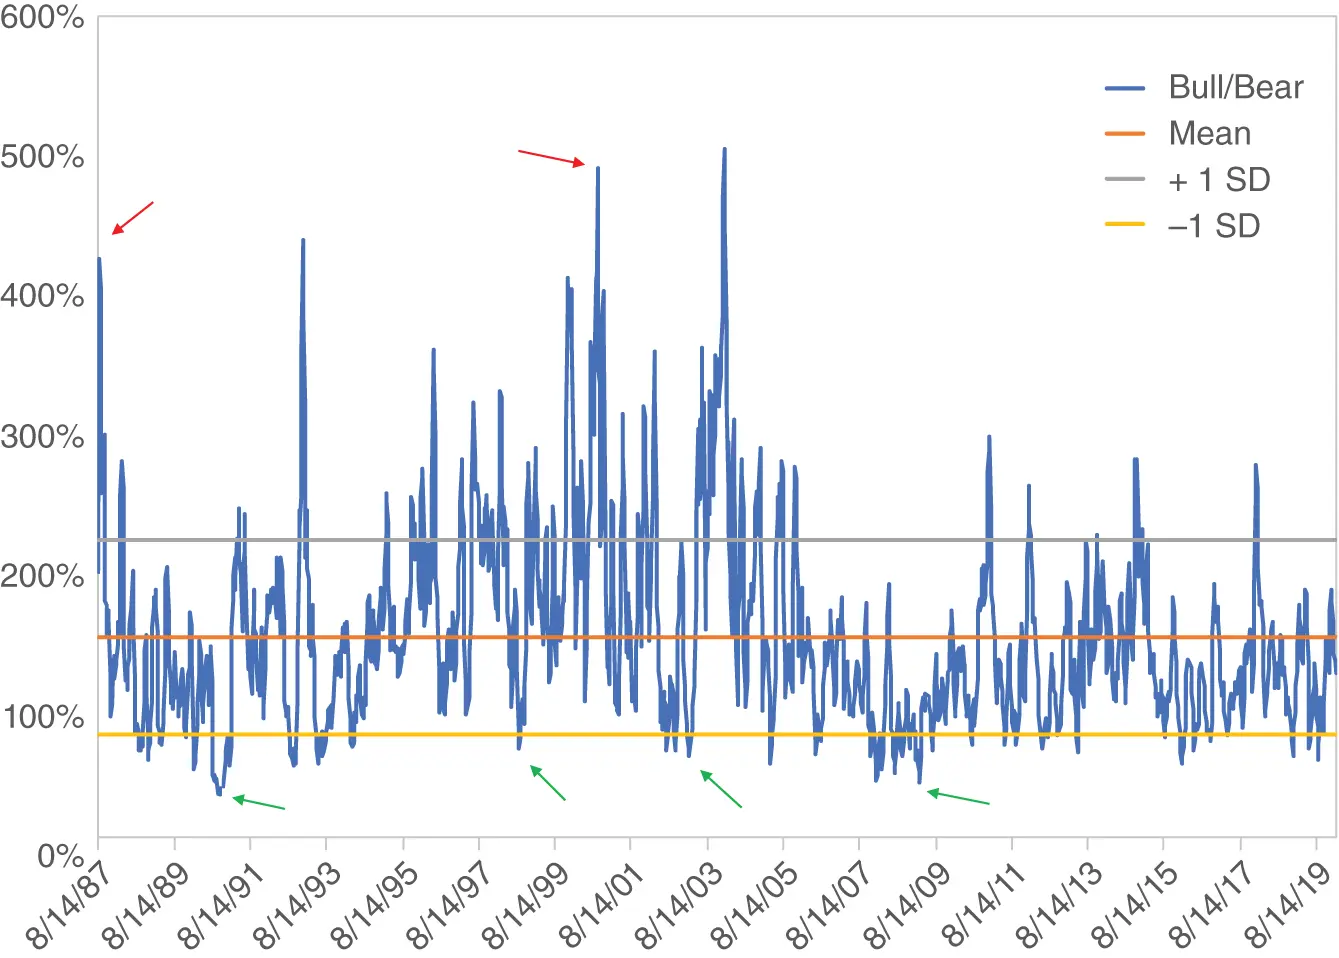
Figure 1.2 AAII Bull/Bear Ratio, Four-Week Average
For the eleven-year bull market from 2009 through 2020, the bull/bear ratio is generally below average. There are a few quick bursts of optimism, when the bull/bear ratio got one standard deviation above the long-term average, but the optimism is nowhere near the magnitude or duration of those that occurred in previous bull markets. This group was mostly wrong the entire way up, frequently posting bull/bear ratios one standard deviation below the historic average.
Читать дальшеИнтервал:
Закладка:
Похожие книги на «Unloved Bull Markets»
Представляем Вашему вниманию похожие книги на «Unloved Bull Markets» списком для выбора. Мы отобрали схожую по названию и смыслу литературу в надежде предоставить читателям больше вариантов отыскать новые, интересные, ещё непрочитанные произведения.
Обсуждение, отзывы о книге «Unloved Bull Markets» и просто собственные мнения читателей. Оставьте ваши комментарии, напишите, что Вы думаете о произведении, его смысле или главных героях. Укажите что конкретно понравилось, а что нет, и почему Вы так считаете.
