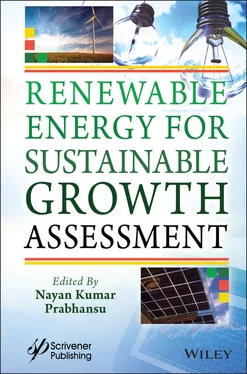
Renewable Energy for Sustainable Growth Assessment
Здесь есть возможность читать онлайн «Renewable Energy for Sustainable Growth Assessment» — ознакомительный отрывок электронной книги совершенно бесплатно, а после прочтения отрывка купить полную версию. В некоторых случаях можно слушать аудио, скачать через торрент в формате fb2 и присутствует краткое содержание. Жанр: unrecognised, на английском языке. Описание произведения, (предисловие) а так же отзывы посетителей доступны на портале библиотеки ЛибКат.
- Название:Renewable Energy for Sustainable Growth Assessment
- Автор:
- Жанр:
- Год:неизвестен
- ISBN:нет данных
- Рейтинг книги:4 / 5. Голосов: 1
-
Избранное:Добавить в избранное
- Отзывы:
-
Ваша оценка:
- 80
- 1
- 2
- 3
- 4
- 5
Renewable Energy for Sustainable Growth Assessment: краткое содержание, описание и аннотация
Предлагаем к чтению аннотацию, описание, краткое содержание или предисловие (зависит от того, что написал сам автор книги «Renewable Energy for Sustainable Growth Assessment»). Если вы не нашли необходимую информацию о книге — напишите в комментариях, мы постараемся отыскать её.
This outstanding new volume
Renewable Energy for Sustainable Growth Assessment — читать онлайн ознакомительный отрывок
Ниже представлен текст книги, разбитый по страницам. Система сохранения места последней прочитанной страницы, позволяет с удобством читать онлайн бесплатно книгу «Renewable Energy for Sustainable Growth Assessment», без необходимости каждый раз заново искать на чём Вы остановились. Поставьте закладку, и сможете в любой момент перейти на страницу, на которой закончили чтение.
Интервал:
Закладка:
14 Chapter 14Figure 14.1 Basic principle of a fuel cell.Figure 14.2 Schematic diagram of basic five fuel cells.Figure 14.3 A simple block diagram of a hybrid distributed energy generation uni...
15 Chapter 15Figure 15.1 Block diagram of a smart home.Figure 15.2 Schematic diagram of an auto faucet system.Figure 15.3 Schematic of the developed prototype: (a) view of pelton wheel, (b) ...Figure 15.4 Jet diameter as a function of pressure head.Figure 15.5 Runner diameter as a function of pressure head.Figure 15.6 Photographic images of the developed prototype-1: (a) wooden pattern...Figure 15.7 Photographic images of developed prototype-2: (a) assembled runner o...Figure 15.8 Photographic images of developed prototype-3: (a) runner of prototyp...Figure 15.9 Block diagram of the experimental setup.Figure 15.10 Experimental setup used for characterization of prototypes.Figure 15.11 Load voltage with respect to load resistance.Figure 15.12 Load current with respect to load resistance.Figure 15.13 Load power with respect to load resistance.Figure 15.14 Efficiency as function of load resistance.Figure 15.15 Charging voltage as a function of time.Figure 15.16 Auto faucet fitted with prototype-3: (a) auto faucet battery, circu...Figure 15.17 Voltage and current levels during single hand-washing activity.Figure 15.18 Power levels during single hand-washing activity.Figure 15.19 Battery’s voltage as a function of washing activities.Figure 15.20 Current as a function of washing activities.Figure 15.21 Power consumption as a function of washing activities.
16 Chapter 16Figure 16.1 Energy resources.Figure 16.2 Light spectrum.Figure 16.3 PV output with different tracking options.Figure 16.4 Latitude.Figure 16.5 Sun position in sky.Figure 16.6 Sun path.Figure 16.7 Cells to string through modules.Figure 16.8 Solar light paths.Figure 16.9 Cell temperature effects.Figure 16.10 Air mass.Figure 16.11 I-V and P-V curves.Figure 16.12 Fill factor.Figure 16.13 Effect of resistance on fill factor.Figure 16.14 Off-grid SPP.Figure 16.15 Grid-connected SPP.Figure 16.16 Hybrid power systems.Figure 16.17 Equivalent circuit of PV module.Figure 16.18 I-V characteristics with varying irradiance at constant temperature...Figure 16.19 P-V characteristics with varying irradiance at constant temperature...Figure 16.20 I-V characteristics with varying temp. at constant irradiance.Figure 16.21 P-V characteristics with varying temperature at constant irradiance...Figure 16.22 PV Syst simulations of power.Figure 16.23 Field real-time test result at 69.5°C.Figure 16.24 Field real-time test result at 35.9°C.Figure 16.25 Power schematic diagram.Figure 16.26 Price break-up.Figure 16.27 Shadow analysis from S-E corner at 8:35 AM.Figure 16.28 Shadow analysis from S-E corner at 4:30 PM.Figure 16.29 Shadow analysis of Inverter room.Figure 16.30 PVsyst estimates of power generation.Figure 16.31 Power schematic diagram of case study.Figure 16.32 Year wise power outputs of financial years 2017-2018.Figure 16.33 Power outputs of financial years 2017-2020.Figure 16.34 Monthly PR and CUF details.Figure 16.35 Load flow simulation without SPP integration.Figure 16.36 Load flow simulation with SPP integration.Figure 16.37 Fault currents before SPP integration.Figure 16.38 Fault currents after SPP integration.
17 Chapter 17Figure 17.1 AC microgrid [5].Figure 17.2 DC microgrid [6].Figure 17.3 Operating modes of microgrid [7].Figure 17.4 PSS for microgrid stability [47].Figure 17.5 (a) Voltage-reactive power (b) frequency-active power droop control ...Figure 17.6 Hierarchical control of microgrids.Figure 17.7 Centralized control strategy.Figure 17.8 Schematic representation of decentralised control [34, 37].Figure 17.9 Control architecture for microgrids.Figure 17.10 Autonomous control of microgrids [28].Figure 17.11 PQ-inverter control [12, 14].Figure 17.12 VSI interfaced with microgrid [71].Figure 17.13 Droop characteristics of DG [26].Figure 17.14 V/f control, (a): voltage control (b): frequency control [26–28].Figure 17.15 Flowchart of GWO technique [21, 23, 27].Figure 17.16 Hybrid GWO and P&O technique [22, 27, 28].Figure 17.17 Pseudo code of WOA technique.
18 Chapter 18Figure 18.1 Classification of techniques for islanding detection in microgrid.Figure 18.2 Flowchart for intelligent islanding detection.Figure 18.3 Post-fault similarity in the three-phase current signal recorded at ...Figure 18.4 Faults in PV array.Figure 18.5 Procedure for detection and classification of distribution line and ...Figure 18.6 PV array with series-parallel combination of PV modules.Figure 18.7 Post-fault similarity in the three-phase current signal recorded at ...
19 Chapter 19Figure 19.1 General fuzzy inference system.Figure 19.2 Fuzzy logic controller.Figure 19.3 Surface of FLC.Figure 19.4 Solar probability distribution curve.Figure 19.5 Wind probability distribution curve.Figure 19.6 Mean-variance efficient frontier.Figure 19.7 Efficient frontier for the Black-Litterman model.Figure 19.8 Mean-MAD efficient frontier.Figure 19.9 Mean-CVaR efficient frontier with a 95% confidence level.Figure 19.10 Mean-CVaR efficient frontier with 99% confidence level.Figure 19.11 Mean-CVaR efficient frontier with 99.99% confidence level.Figure 19.12 Mean-CVaR efficient frontiers comparison.
20 Chapter 20Figure 20.1 Necessitated control of PMSG-based WECS.Figure 20.2 Space vector orientation of PMSG Rotor Flux.Figure 20.3 PMSG equivalent circuit in SRF.Figure 20.4 Space vector orientation of the utility phase voltage.Figure 20.5 Utility voltage Lissajous pattern in stationary frame during various...Figure 20.6 Generalized SRF-PLL structure for obtaining utility information.Figure 20.7 PMSG rotor angular frequency and position computation.Figure 20.8 Conventional rotor angular and position estimation based on (a) Q-PL...Figure 20.9 Overall vector control scheme for PMSG-WES with sensorless rotor ang...Figure 20.10 Starting characteristics (a), (b) electrical angular frequency, ωes ...Figure 20.11 Rotor speed and position estimation for gust and turbulence wind ve...Figure 20.12 Rotor position estimation considering the effect of converter non-l...Figure 20.13 Rotor position estimation considering the impact of converter non-l...Figure 20.14 Proposed method performance evaluation under distorted utility (a) ...Figure 20.15 Performance evaluation under the variation of PMSG parameters (ii) ...Figure 20.16 FRT Requirements of IECG.Figure 20.17 Inner current controller with PMSG modelling.Figure 20.18 Inner current control loop.Figure 20.19 MSC Controller.Figure 20.20 SRF model of dc-link voltage controller and GSC with the filter.Figure 20.21 Outer loop (DC-link voltage) PI regulator design.Figure 20.22 GSC controller.Figure 20.23 Procedure for MSC reference power generation (a) Power reference sc...Figure 20.24 Overall modified control structure of PMSG-based WECS.Figure 20.25 Proposed controller performance evaluation for the IEGC FRT require...Figure 20.26 Controllers I, II, and proposed method performance under distorted ...Figure 20.27 Conventional dc-link voltage control on MSC.Figure 20.28 Root loci under fast dc-link voltage regulation.Figure 20.29 Bode plot under fast dc-link voltage regulation.Figure 20.30 Small-signal modelling of the Vdc controller.Figure 20.31 Root locus under slow dc-link voltage regulation.Figure 20.32 Bode plot under slow dc-link voltage regulation.Figure 20.33 DC-link controller with damping setpoint (a) Proposed method with d...Figure 20.34 GSC DPC scheme.Figure 20.35 Overall modified control structure with MSC proposed active damping...Figure 20.36 Performance of during a variation in wind velocity: (a) wind profil...Figure 20.37 Analytical simulation results for IEGC profile during unsymmetrical...Figure 20.38 MSC controller’s system function closed loop poles in S-plane durin...
21 Chapter 21Figure 21.1 Hypocaust flues from a Roman bath.Figure 21.2 Dehumidification techniques.Figure 21.3 Rotary desiccant wheel [8].Figure 21.4 Components of liquid desiccant based air conditioner [48].Figure 21.5 Schematic of radiant cooling system with DOAS.Figure 21.6 Building geometry with solar collector installation.Figure 21.7 Outdoor air dry bulb temperature and humidity ratio in (a) warm-humi...Figure 21.8 Schematic layout for (a) case 1 and (b) case 2.Figure 21.9 Maintained zone air temperature and humidity level (a) warm-humid cl...Figure 21.10 Partition energy consumption by different components (a) warm-humid...Figure 21.11 Net annual energy consumption by case 1 and case 2.Figure 21.12 Hourly variation in COP for case 2 (a) warm-humid, (b) hot-dry clim...Figure 21.13 Annual heat energy requirement and supply (a) warm-humid, (b) hot-d...Figure 21.14 Analysis of solar fraction under different conditions.
Читать дальшеИнтервал:
Закладка:
Похожие книги на «Renewable Energy for Sustainable Growth Assessment»
Представляем Вашему вниманию похожие книги на «Renewable Energy for Sustainable Growth Assessment» списком для выбора. Мы отобрали схожую по названию и смыслу литературу в надежде предоставить читателям больше вариантов отыскать новые, интересные, ещё непрочитанные произведения.
Обсуждение, отзывы о книге «Renewable Energy for Sustainable Growth Assessment» и просто собственные мнения читателей. Оставьте ваши комментарии, напишите, что Вы думаете о произведении, его смысле или главных героях. Укажите что конкретно понравилось, а что нет, и почему Вы так считаете.
