Geophysical Monitoring for Geologic Carbon Storage
Здесь есть возможность читать онлайн «Geophysical Monitoring for Geologic Carbon Storage» — ознакомительный отрывок электронной книги совершенно бесплатно, а после прочтения отрывка купить полную версию. В некоторых случаях можно слушать аудио, скачать через торрент в формате fb2 и присутствует краткое содержание. Жанр: unrecognised, на английском языке. Описание произведения, (предисловие) а так же отзывы посетителей доступны на портале библиотеки ЛибКат.

- Название:Geophysical Monitoring for Geologic Carbon Storage
- Автор:
- Жанр:
- Год:неизвестен
- ISBN:нет данных
- Рейтинг книги:4 / 5. Голосов: 1
-
Избранное:Добавить в избранное
- Отзывы:
-
Ваша оценка:
Geophysical Monitoring for Geologic Carbon Storage: краткое содержание, описание и аннотация
Предлагаем к чтению аннотацию, описание, краткое содержание или предисловие (зависит от того, что написал сам автор книги «Geophysical Monitoring for Geologic Carbon Storage»). Если вы не нашли необходимую информацию о книге — напишите в комментариях, мы постараемся отыскать её.
Geophysical Monitoring for Geologic Carbon Storage
Volume highlights include: Geophysical Monitoring for Geologic Carbon Storage
The American Geophysical Union promotes discovery in Earth and space science for the benefit of humanity. Its publications disseminate scientific knowledge and provide resources for researchers, students, and professionals.
Geophysical Monitoring for Geologic Carbon Storage — читать онлайн ознакомительный отрывок
Ниже представлен текст книги, разбитый по страницам. Система сохранения места последней прочитанной страницы, позволяет с удобством читать онлайн бесплатно книгу «Geophysical Monitoring for Geologic Carbon Storage», без необходимости каждый раз заново искать на чём Вы остановились. Поставьте закладку, и сможете в любой момент перейти на страницу, на которой закончили чтение.
Интервал:
Закладка:
2.2.2. SAR Interferometry
Radar sensors, mounted on satellite platforms, airplanes, or even a tripod on the ground, make it possible to measure ground displacement with millimeter accuracy, thanks to a particular technique known as SAR (Synthetic Aperture Radar) interferometry (InSAR) (see Ferretti, 2014, for a comprehensive review). The satellites both send and receive signals, recording the complex returns and using them for both imaging and range (distance) estimation ( Fig. 2.1). Unlike optical systems, the sensors operate in the microwave domain, with wavelengths of a few centimeters, 100,000 times longer than those of the visible spectrum. Being an active system, a radar sensor can function 24 hours a day and year‐round, as it can see through clouds, fog, and rain, independent of the Earth's illumination.
An important feature of a SAR system is its ability to record both amplitude and phase information. While the amplitude depends on the amount of energy backscattered toward the sensor, the phase is related to the distance between the phase center of the radar antenna and the target on ground. More precisely, the phase value ϕ of a pixel P of a radar image can be modeled as a mixture of four distinct contributions (Ferretti et al., 2007a):
(2.1) 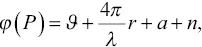
where ϑ is the phase shift related to the location and to the reflectivity of all elementary scatterers within the resolution cell associated with pixel P . The coefficient  is the most significant contribution in any geodetic application, as it is associated with the sensor‐to‐target distance r . The term a is a delay introduced by the medium (the Earth's atmosphere) that the electromagnetic wave propagates through. This quantity, known as the atmospheric phase screen (APS), is often the main source of noise and can compromise the quality of any distance estimate. The last term, n , is a phase contribution related to system noise (thermal noise, quantization, etc.).
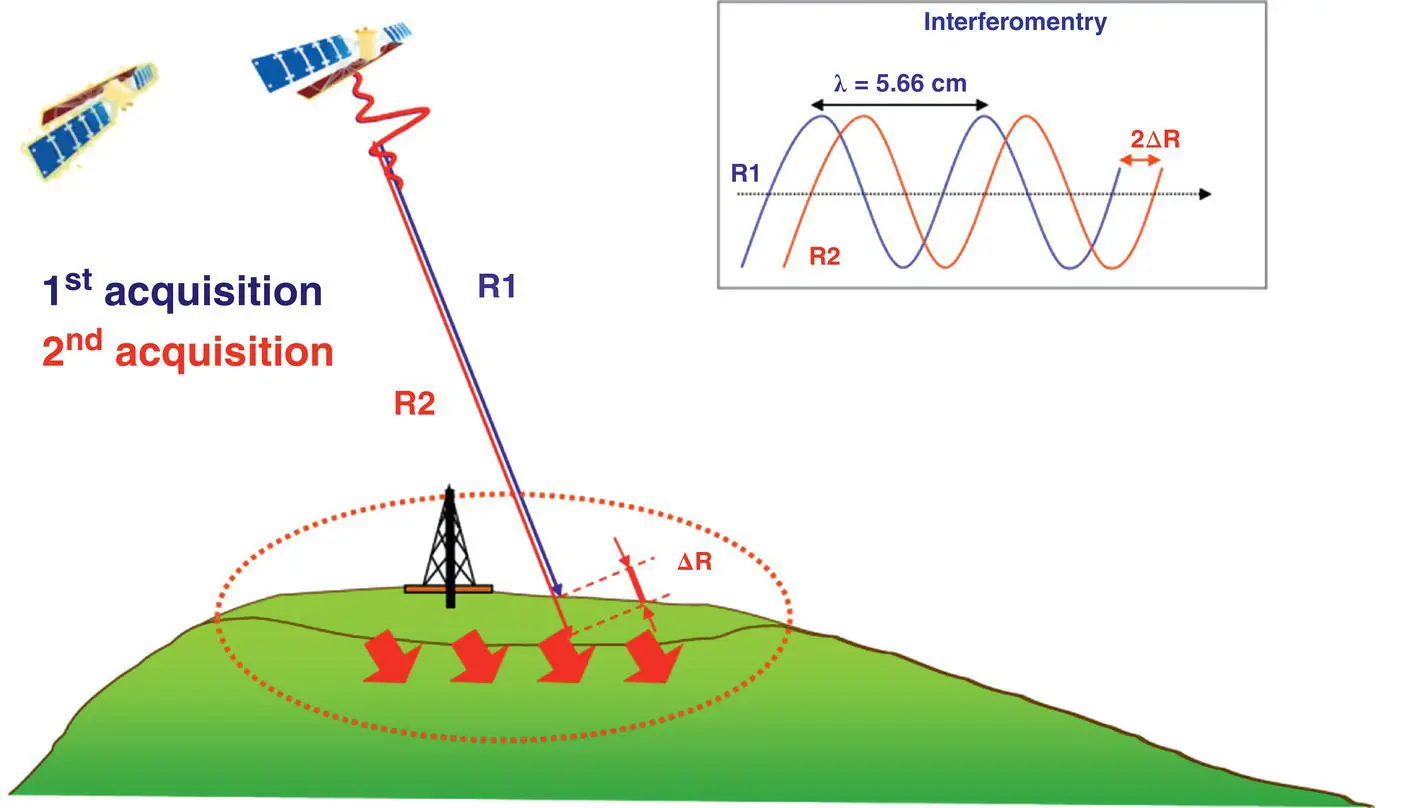
Figure 2.1 A schematic showing the relationship between ground displacement and signal phase shift. The numeric value of the wavelength, λ, is that used by the ERS satellites operated by the European Space Agency (ESA).
The phase values contained in a single SAR image are of little practical use, as it is impossible to separate the different contributions in equation (2.1), at least without prior information. The basic idea of SAR interferometry is to measure the phase change , or interference, over time, between two radar images, generating an interferogram I :
(2.2) 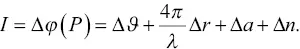
If we consider an idealized situation where the noise is negligible, the surface character (reflectivity) and atmospheric conditions are constant between the two SAR acquisitions, then equation 2.2reduces to
(2.3) 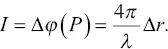
Therefore, if a point on the ground moves during the time interval between the acquisition of the two radar images with similar geometry, the distance between the sensor and the target changes, creating a phase shift proportional to the displacement ( Fig. 2.1). Equation (2.3)explains why interferometric SAR techniques can measure range variations with high sensitivity: the unit of length of the measurement is the wavelength (a few centimeters long) rather than the range resolution of the radar sensor (typically a few meters). A displacement of the radar target by a distance of λ/2 will create a phase shift of 2π radians. Therefore, a range variation of just 1 mm creates a phase shift of more than 20 degrees between two SAR images acquired in the X‐band (λ = 3 cm), which can be easily detected.
A direct approach, involving the computation of phase variations on a pixel‐by‐pixel basis between two radar images, can be used successfully only if the reflective character of the radar target does not change over time, the signal‐to‐noise‐ratio (SNR) is high enough, and the atmospheric phase components are negligible. When this is not the case, the analysis of a single interferogram is not sufficient to produce useful estimates and a multi‐interferogram approach is required. In fact, the analysis of long temporal series of SAR images, as described in the next subsection, is perhaps the best way to disentangle the different phase contributions and retrieve high‐quality displacement data.
2.2.3 Multitemporal Analysis
Techniques utilizing a suite of interferograms, multi‐interferogram approaches, are aimed at overcoming limitations associated with phase decorrelation and atmospheric effects. The PSInSAR technique (Ferretti et al., 2000, 2001), developed in the late nineties, initiated a “second generation” of algorithms addressing the difficulties related to conventional (single‐pair) analyses. The basic idea is to compare many SAR images and to focus the analysis on high‐quality radar targets, usually referred to as permanent scatterers (PS). Such targets exhibit very stable radar signatures and allow the implementation of powerful filtering procedures to estimate and remove atmospheric disturbances, so that extremely accurate displacement data can be estimated. Common to all geodetic applications, the displacements are computed with respect to a stable reference point.
A recent enhancement of the permanent scatterer technique, the SqueeSAR algorithm (Ferretti et al., 2011), allows for two families of stable points on the Earth's surface, permanent scatterers and distributed scatterers. As noted above, permanent scatterers (PS) are radar targets that are highly reflective (backscatter significant energy), generating very bright pixels in a SAR scene. Permanent scatterers are associated with stable features such as buildings, metallic objects, pylons, antennae, outcrops, and so on. Distributed scatterers (DS) are radar targets usually composed of a localized collection of pixels in the SAR image, all exhibiting a very similar radar signature. Such scatterers usually correspond to rocky areas, detritus, and areas generally free of vegetation. Temporal decorrelation, though still present in distributed scatterers, is small enough to allow for the retrieval of their displacements. Provided enough SAR images are available, one can determine a time series of range change (displacement along the line of sight) regardless of the type of scatterer identified by the algorithm. Thus, estimates of the geographic coordinates of the measurement point (located with a precision of about 1 m), average annual velocity of the measurement point (with a precision dependent on the number of data available, but typically less than 1 mm/yr), and time‐series of scatterer displacement (with a precision typically better than 4 – 5 mm for individual measurements).
In order to successfully perform a multi‐interferogram analysis, a minimum number of satellite images (approximately 10 – 15) are required. This is necessary to create a reliable statistical analysis of the radar returns, making it possible to identify pixels that can be used in the analysis. The higher the number of images acquired and processed, the better the quality of the results. For displacement data associated with permanent and distributed scatterers, a key factor is the distance from the reference point. The relative accuracy can be better than a few millimeters for a distance less than the average correlation length of the atmospheric components (about 4 km at midlatitudes). Average displacement rates can be estimated with a precision better than 1 mm/yr, depending on the number of data available and the temporal span of the acquisitions (Ferretti, 2014).
Читать дальшеИнтервал:
Закладка:
Похожие книги на «Geophysical Monitoring for Geologic Carbon Storage»
Представляем Вашему вниманию похожие книги на «Geophysical Monitoring for Geologic Carbon Storage» списком для выбора. Мы отобрали схожую по названию и смыслу литературу в надежде предоставить читателям больше вариантов отыскать новые, интересные, ещё непрочитанные произведения.


Обсуждение, отзывы о книге «Geophysical Monitoring for Geologic Carbon Storage» и просто собственные мнения читателей. Оставьте ваши комментарии, напишите, что Вы думаете о произведении, его смысле или главных героях. Укажите что конкретно понравилось, а что нет, и почему Вы так считаете.