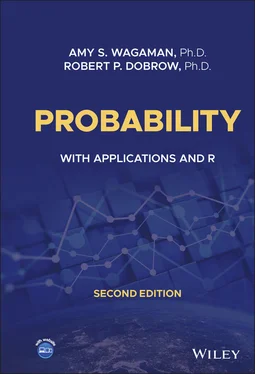
Robert P. Dobrow - Probability
Здесь есть возможность читать онлайн «Robert P. Dobrow - Probability» — ознакомительный отрывок электронной книги совершенно бесплатно, а после прочтения отрывка купить полную версию. В некоторых случаях можно слушать аудио, скачать через торрент в формате fb2 и присутствует краткое содержание. Жанр: unrecognised, на английском языке. Описание произведения, (предисловие) а так же отзывы посетителей доступны на портале библиотеки ЛибКат.
- Название:Probability
- Автор:
- Жанр:
- Год:неизвестен
- ISBN:нет данных
- Рейтинг книги:4 / 5. Голосов: 1
-
Избранное:Добавить в избранное
- Отзывы:
-
Ваша оценка:
Probability: краткое содержание, описание и аннотация
Предлагаем к чтению аннотацию, описание, краткое содержание или предисловие (зависит от того, что написал сам автор книги «Probability»). Если вы не нашли необходимую информацию о книге — напишите в комментариях, мы постараемся отыскать её.
distinguished researchers Drs. Robert Dobrow and Amy Wagaman deliver a thorough introduction to the foundations of probability theory. The book includes a host of chapter exercises, examples in R with included code, and well-explained solutions. With new and improved discussions on reproducibility for random numbers and how to set seeds in R, and organizational changes, the new edition will be of use to anyone taking their first probability course within a mathematics, statistics, engineering, or data science program.
New exercises and supplemental materials support more engagement with R, and include new code samples to accompany examples in a variety of chapters and sections that didn’t include them in the first edition.
The new edition also includes for the first time:
A thorough discussion of reproducibility in the context of generating random numbers Revised sections and exercises on conditioning, and a renewed description of specifying PMFs and PDFs Substantial organizational changes to improve the flow of the material Additional descriptions and supplemental examples to the bivariate sections to assist students with a limited understanding of calculus Perfect for upper-level undergraduate students in a first course on probability theory, is also ideal for researchers seeking to learn probability from the ground up or those self-studying probability for the purpose of taking advanced coursework or preparing for actuarial exams.
 The cdf has points of d...FIGURE 6.5: Zoe arrives at the bus station 10 minutes after Adrian. But the ...FIGURE 6.6: Bathtub curves are used in reliability engineering to model fail...FIGURE 6.7: Joint density
  FIGURE 6.8: Shaded region defined by
  FIGURE 6.9: (a) Joint density
  . (b) Domain of joint density. Shaded region ...FIGURE 6.10: (a) Joint density. (b) Shaded region shows event
  in the part ...FIGURE 6.11: Accept–reject method for simulating points uniformly distribute...FIGURE 6.12: One thousand points generated in the unit sphere using the acce...
 , ...FIGURE 7.3: Approximating the binomial probability
  using a normal distribu...FIGURE 7.4: Four gamma distributions.FIGURE 7.5: The histogram is from simulating the sum of 20 exponential varia...FIGURE 7.6: Poisson process: relationships of underlying random variables.FIGURE 7.7: Four beta distributions.FIGURE 7.8: Scale-invariance of the Pareto distribution. The density curve i...
 , where
  The curve is the density fu...FIGURE 8.2: The geometry of the lighthouse problem.FIGURE 8.3: Simulating from density
  using the inverse transform method.FIGURE 8.4: Simulated distribution of three independent exponential random v...FIGURE 8.5: Distributions from (a) to (c): uniform, sum of two independent u...FIGURE 8.6: The shaded region is the event that Angel and Lisa meet.FIGURE 8.7: Let
  be uniformly distributed on the triangle. The shaded regio...FIGURE 8.8: Region
  for
for  and
and  .FIGURE 8.9: Geometry of Buffon's needle problem. The needle intersects a lin...FIGURE 8.10: Buffon's needle problem is solved by finding the area under the...
 given
given  . The density function ...FIGURE 9.3: Simulations of (a) joint distribution of
  , (b) marginal distrib...FIGURE 9.4: Cumulative distribution function of insurance payout has jump di...FIGURE 9.5: Number of exams versus number of A's. Correlation is 0.775.FIGURE 9.6: Distribution of arrowtooth flounder in Alaskan fisheries. Ellips...FIGURE 9.7: Contour plots of standard bivariate normal densities with (a)
  ,...FIGURE 9.8: Bivariate standard normal distribution.FIGURE 9.9: Galton's height data for fathers and sons are well fit by a biva...FIGURE 9.10: Plot of 1000 observations from bivariate standard normal distri...
 in 1000 fair coin flips....FIGURE 10.4: Sequences of averages
  for the Cauchy distribution whose expec...FIGURE 10.5: Using probability and random numbers to estimate the area of th...FIGURE 10.6: Histogram of
  from an underlying sequence of
  Bernoulli trial...FIGURE 10.7: The simulated distribution of
  for four population distributio...FIGURE 10.8: Four random walk paths of 10,000 steps. The horizontal axis rep...FIGURE 10.9: The normalized sum of just six dice throws comes close to the n...
 vertices. (b) Complete graph on
  vertices...FIGURE 11.3: The
  -hypercube graph for
  (a) and
  (b).FIGURE 11.4: Weighted graph.FIGURE 11.5: Weighted graph for the general two-state Markov chain.FIGURE 11.6: Gibbs sampler simulation of bivariate standard normal with
  .FIGURE 11.7: Distribution of the marginal distribution of
  from 10,000 runs...FIGURE 11.8: Lollipop graph on nine vertices.FIGURE 11.9: Weighted graph.
