X-Ray Fluorescence in Biological Sciences
Здесь есть возможность читать онлайн «X-Ray Fluorescence in Biological Sciences» — ознакомительный отрывок электронной книги совершенно бесплатно, а после прочтения отрывка купить полную версию. В некоторых случаях можно слушать аудио, скачать через торрент в формате fb2 и присутствует краткое содержание. Жанр: unrecognised, на английском языке. Описание произведения, (предисловие) а так же отзывы посетителей доступны на портале библиотеки ЛибКат.

- Название:X-Ray Fluorescence in Biological Sciences
- Автор:
- Жанр:
- Год:неизвестен
- ISBN:нет данных
- Рейтинг книги:5 / 5. Голосов: 1
-
Избранное:Добавить в избранное
- Отзывы:
-
Ваша оценка:
X-Ray Fluorescence in Biological Sciences: краткое содержание, описание и аннотация
Предлагаем к чтению аннотацию, описание, краткое содержание или предисловие (зависит от того, что написал сам автор книги «X-Ray Fluorescence in Biological Sciences»). Если вы не нашли необходимую информацию о книге — напишите в комментариях, мы постараемся отыскать её.
Discover a comprehensive exploration of X-ray fluorescence in chemical biology and the clinical and plant sciences X-Ray Fluorescence in Biological Sciences: Principles, Instrumentation, and Applications
X-Ray Fluorescence in Biological Sciences: Principles, Instrumentation, and Applications
X-Ray Fluorescence in Biological Sciences — читать онлайн ознакомительный отрывок
Ниже представлен текст книги, разбитый по страницам. Система сохранения места последней прочитанной страницы, позволяет с удобством читать онлайн бесплатно книгу «X-Ray Fluorescence in Biological Sciences», без необходимости каждый раз заново искать на чём Вы остановились. Поставьте закладку, и сможете в любой момент перейти на страницу, на которой закончили чтение.
Интервал:
Закладка:
One more difference between the techniques is that with an EDXRF system, the full spectrum is obtained virtually at once. So, a range of elements belonging to the periodic table can be determined simultaneously. With an WDXRF system, the spectrum has been procured by a series of discrete step, which is time‐consuming, and also expensive due to the restricted number of detectors.
1.2.1 Micro‐XRF
XRF is a bulk technique with the analysis range varying from several millimeters to several centimeters. Inhomogeneous samples compacted into a pellet form and thereby make it little time consuming. Also it requires a large amount of sample material for the analysis. Many advancements have been made in the field of X‐ray optics that gave rise to originate to narrow X‐ray beams (1 mm to 10 μm). Such developments allow even a solo microscopic particle to be discretely analyzed for an explicit elemental image of high spatial resolution.
XRF [7] is based on an energy‐dispersive detection system. For the generation of precise and accurate elemental images consisting of thousands of pixels, a fast acquisition is needed at each and every pixel position. When using a simple WDXRF spectrometer, the scanning procedure is time consuming and does not support the imaging applications as provided by XRF. XRF has broad range of research applications including geology, mineralogy, gemology, archaeology, motor engineering, electronics, pharmaceutics, environmental studies, and biomedicine.
1.3 Comparison with Other Analytical Methods
1.3.1 Overview
Owing to advancements in XRF spectrometry, EDXRF systems are used in combination with scanning electron microscopy () to determine elemental constituents at small scales. Importantly, XRF is used with synchrotron radiation sources (SRXRF) which is very similar to μ‐XRF that covers numerous applications.
There exist many analytical techniques such as XRF, μ‐XRF, SRXRF, total reflection X‐ray spectroscopy (TXRF), atomic absorption spectrometry (AAS), laser‐induced breakdown spectroscopy (LIBS), laser ablation inductively coupled plasma mass spectroscopy (LA‐ICP‐MS), inductively coupled plasma optical emission spectrometry (ICP‐OES), time‐of‐flight secondary ion mass spectrometry (TOF‐SIMS), PIXE, etc. which are currently being used for elemental analysis of materials, including biological samples. Some important parameters that distinguish the analytical capabilities of the techniques such as elemental range, imaging possibility, depth resolution, and instrumental effort are summarized in Table 1.1[3,8–11].
All the techniques have their own advantages and different analytical capabilities that can be used to analyze different kinds of materials. Also, the instrumental efforts of these techniques are also different and thus, some techniques require more or less effort on the part of the operator. PIXE and synchrotron radiation‐XRF require high instrumental effort [3, 8, 9]. Additionally, complex sample handling is necessary in ultrahigh vacuum for Auger electron spectrometry, transmission electron microscopy (TEM), X‐ray photoelectron spectroscopy (XPS), and secondary ion mass spectrometry (SIMS) [3, 8]. On the other hand, a complex laser interaction with the samples occurs in LA‐ICP‐MS. However, a few methods with a restricted spatial resolution, such as conventional XRF or atomic emission spectroscopy (AES), are also available and are often used for elemental analysis in comparison to above techniques.
The methods discussed above produce similar information about the sample compositions and in most cases they provide complementary information. The utility of these techniques depends on their analytical performance and availability particularly their costs.
Figure 1.1shows a concise visual reference for comparing analytical techniques used for materials characterization, elemental analysis, evaluation surface analysis, and purity surveys etc. in terms of their detection limits and analytical resolutions.
1.3.2 Inductively Coupled Plasma (ICP) Analysis
ICP spectroscopy is the most popular analytical method to detect and quantify the chemical elements present in a given sample. This is based on the ionization of samples by extremely hot plasma, usually made from argon gas [4]. In the next Sections 1.3.2.1and 1.3.3, we have briefly discussed the working principles and analytical capabilities of two forms of ICP spectroscopy such as ICP‐MS and ICP‐AES.
1.3.2.1 Inductively Coupled Plasma Mass Spectrometry (ICP‐MS)
ICP‐MS uses inductively coupled plasma to ionize the atoms [3, 4]. It is used to atomize the sample, creating polyatomic ions, which are then detected. The ions from the plasma are separated through a series of cones into a mass spectrometer, usually a quadrupole. The extraction of ions is based on their mass‐to‐charge ratio. An ionic signal is received by a detector which is correlated to the concentrations of atoms in the sample. These concentrations are obtained by drawing the calibration curves using some certified reference materials (CRMs).
It has the capability to investigate several metals as well as non‐metals in the liquefied samples at milligram to nanogram levels per liter. It is also used for isotopic analysis of the elements. This technique has been recognized as one of the most important analytical techniques in a variety of industries for the monitoring of impurities in semiconductor manufacturing, environmental monitoring, geochemical analysis, mining and metallurgy, pharmaceutical industries, and biomedical analysis. ICP‐MS has a good precision, sensitivity, and greater speed. The main disadvantage of ICP‐MS is that it produces many interfering species like component gases of air, argon from the plasma, and contamination from glassware and cones used.
Table 1.1 Overview of some analytical techniques including AAS, ICP, LIBS, XRF, μ‐XRF, SR‐XRF, and TOF‐SIMS [3,8–11].
| Techniques | Excitation source | Elements detected | Resolution | Detection limit | Imaging | Instrument efforts | Scan size/area analysis (mm) | Specific remarks | |
|---|---|---|---|---|---|---|---|---|---|
| Spatial | Depth | ||||||||
| XRF | X‐rays | B‐U (WDXRF); Na‐U (EDXRF) | 20 mm | 10 nm | 1–100 ppm for most elements | No | Medium | ~30 μm (EDXRF) and ~500 μm (WDXRF) | Non‐destructive |
| μ‐XRF | X‐rays | Multi‐element (Al‐U) | 20–500 μm | 10 nm | 20–50 ppm | Yes | Medium | Upto 190 × 160 | Relatively slow, risk for radiation damage |
| μ‐SRXRF | X‐rays | Multi‐element | >10 nm | 1 nm | 5 ppm | Yes | Very high | ||
| TXRF | X‐rays | Na‐U | >3 nm | Yes (Optional) | High | Polished surface required for best detection limits, Can analyze many substrates, e.g. Si, SiC, GaAs, InP, sapphire, glass | |||
| X‐ray fluorescence microscopy (XFM) | X‐rays | Multi‐element (Al‐U but poor 2nd row Z > 42 | 0.05–1 μm | >100 μm | <0.1 ppm | Yes | Medium | Upto 150 × 100 | Ability for spectroscopy (XAS) to determine chemical speciation |
| SEM/TEM‐EDS | Electrons | Multi‐element (O‐U) | <0.5 μm | <0.5 μm | 1000 ppm | Yes | Medium | 7 × 7 | Resolution depends on element investigated |
| PIXE | Protons (for biological applications) | Multi‐element (Na‐U) | 2 μm | 10–100 μm | 1–10 ppm | Limited | Very high | 4 × 4 | Quantitative measurements of heavier elements that can't be resolved by RBS alone |
| XPS/ESCA | X‐rays | Li‐U (Chemical bonding information) | 0.5 nm | 3 nm | 100 ppm | Yes | High | Smallest analytical area ~10 μm | Limited specific organic information and sample compatibility with UHV environment. |
| Auger (AES) | Electrons | Li‐U | 0.2 μm | 3 nm | 100 ppm | Yes | High | Small area analysis (~20 nm minimum) | Analysis of insulators can be difficult and samples must be vacuum compatible. |
| SIMS | Ions | H‐U including isotopes | 5 μm | 0.1 nm | 1 ppb | Yes | Medium | Small‐area analysis (1–10 μm) | Destructive,no chemical bonding information, and sample must be solid and vacuum compatible. |
| TOF‐SIMS | Ions | Full periodic table coverage, plus molecular species | <0.1 μm | 1 nm | 1 ppm | Yes | High | Samples must be vacuum compatible | |
| RBS | He 2+Ions (alpha particles) | B‐U | 2 mm | 10–20 nm | 1–1000 ppm | No | Medium | Large analysis area (~2 mm) | Non‐destructive, Conductor and insulator analysis |
| ICP‐OES | Argon plasma | Li‐U (except gases, halogens, low quantity of P and S) | No | Bulk chemical analysis technique | <1 ppb | No | Medium | No | C, H, N, O and halogens cannot be determined. |
| ICP‐MS | Plasma source | Most of the elements | No | No | Typically ng/ L | No | Medium | No | Polyatomic mass interferences, atmospherics and light halogens |
| LA‐ICP‐MS | Photos (Laser) | Multi‐element (Al‐U) | 100 nm | 0.1–1 μm | <1 ppb | Yes (Limited: ablated surface) | Medium | 20 × 20 | Elemental, stable isotope distribution analysis and mapping |
| LIBS | Photos (Laser) | All elements detectable | >0.1 μm | 1 ppm | Yes (Limited) | Medium | Strong matrix‐effects on emission spectra | ||
| Atom Probe Tomography (APT) | Laser or voltage pulse | H‐U | <1 nm | 0.3 nm | ~10 ppm | Yes | High | 50 × 50 nm 2 | Ability to identify isotopes, Cluster analysis for nanoscale precipitates |
| STEM | Electrons | B‐U (EDS) | 3 nm | 3 nm | Typically ppm | Yes | High | 5 μm x 5 μm | Strong contrast between crystalline vs amorphous materials without chemical staining |
| AAS | Radiation Sources (Hollow Cathode Lamps HCL) | Most of the elements except some lighter elements | Typically μg/l | No | Medium | No | Destructive, time consuming, sequential analysis of 1 to 6 elements, separate method of optimization required for each type of sample. |
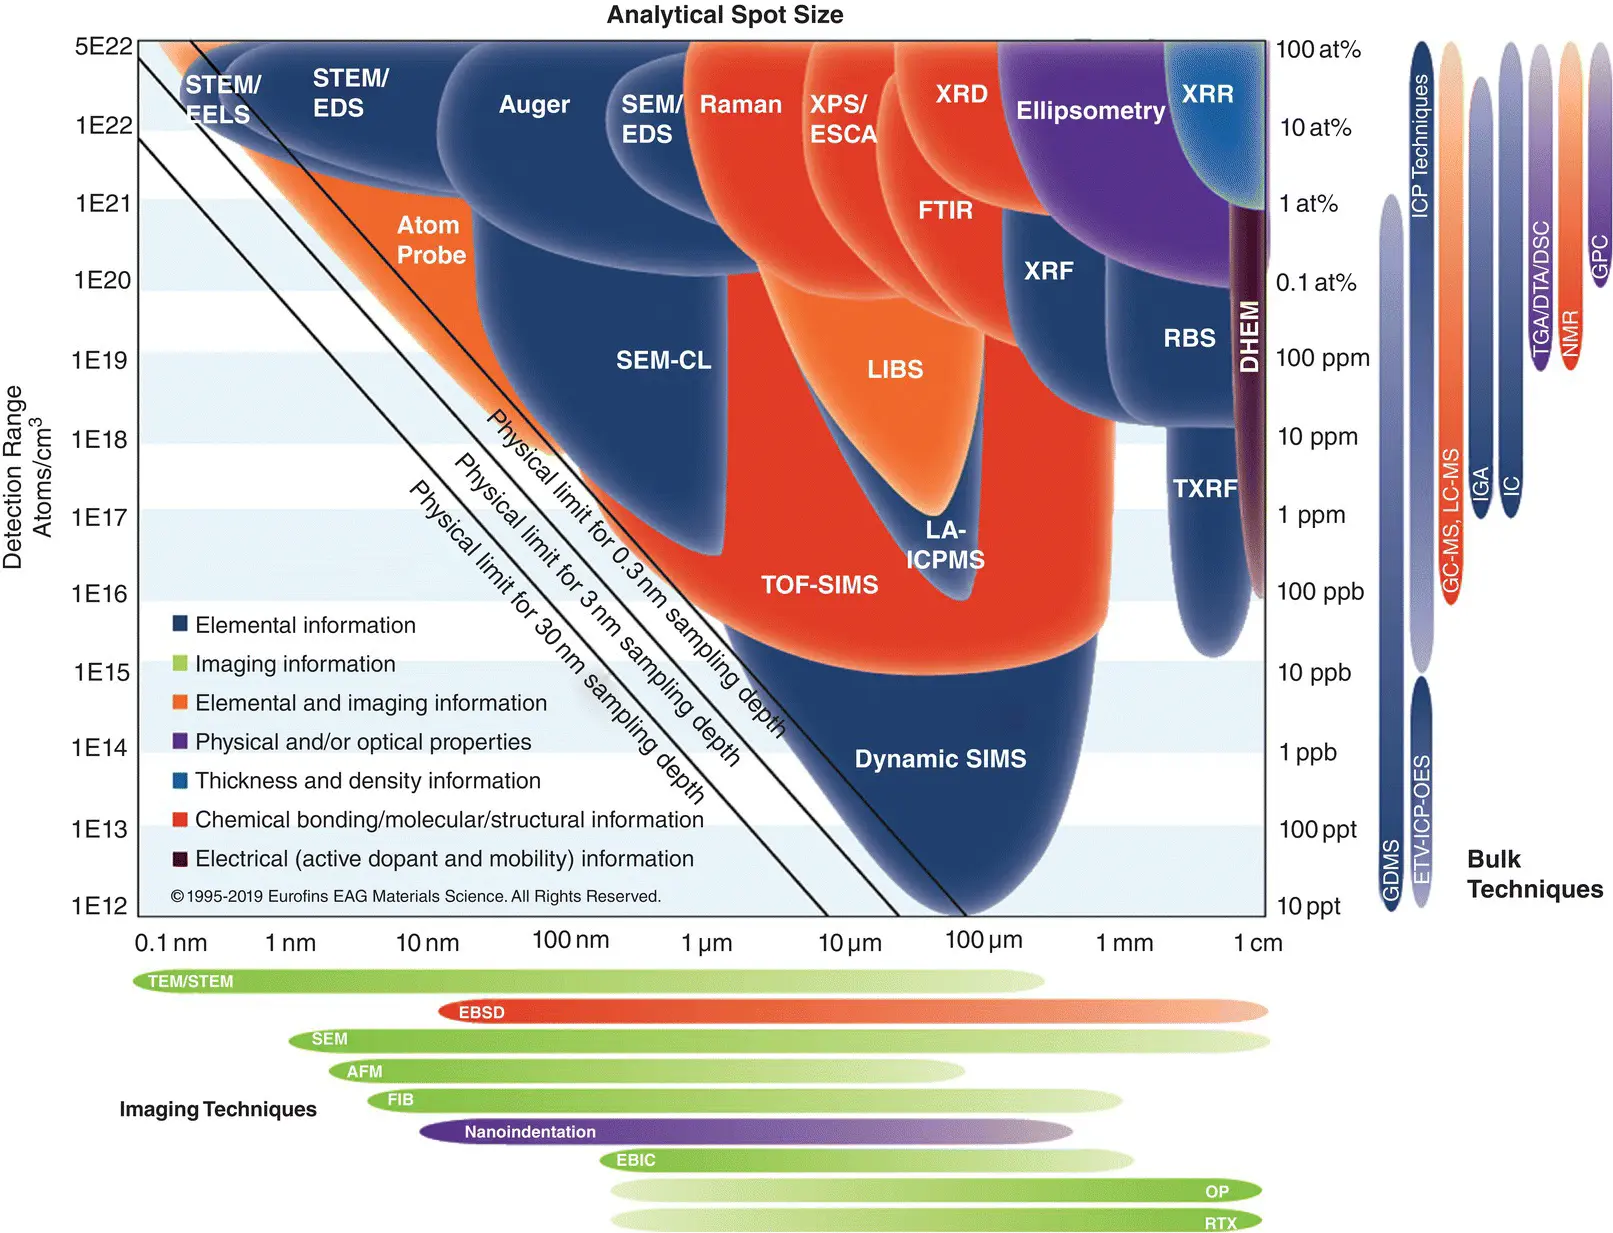
Figure 1.1 A concise visual reference of most of the ring analytical techniques to compare the detection limits and analytical resolutions for materials characterization.
Читать дальшеИнтервал:
Закладка:
Похожие книги на «X-Ray Fluorescence in Biological Sciences»
Представляем Вашему вниманию похожие книги на «X-Ray Fluorescence in Biological Sciences» списком для выбора. Мы отобрали схожую по названию и смыслу литературу в надежде предоставить читателям больше вариантов отыскать новые, интересные, ещё непрочитанные произведения.


Обсуждение, отзывы о книге «X-Ray Fluorescence in Biological Sciences» и просто собственные мнения читателей. Оставьте ваши комментарии, напишите, что Вы думаете о произведении, его смысле или главных героях. Укажите что конкретно понравилось, а что нет, и почему Вы так считаете.